Question
Question: How do you graph the line \[x=0\] ?...
How do you graph the line x=0 ?
Solution
In the given question, we have been asked to graph the line x=0 . Now, this line is going to be parallel to the y-axis. Hence, that means that its y-coordinate is going to be constant (0 in this case). The given value of the x-coordinate is how far the line from the y-axis is.
Complete step by step solution:
First, to solve such types of questions, we need to draw the x-axis and the y-axis on the graph. The x-axis is simply the horizontal axis in the graph and the y-axis is the vertical one. To draw the graph of x=0 , we need to find the points which lie on x=0 .
The graph of x=0 will include all points for which x-coordinate is 0. Therefore, points (0,0) , (0,1) , (0,−1) , (0,2) , (0,−2) etc. are the required points.
Now, let’s plot these points in the graph
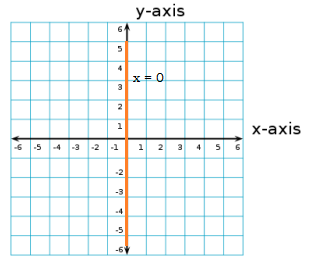
The highlighted line represents x=0 on the graph.
Note:
While solving this question, many students misinterpret x=0 as a line in which y-coordinates of all points is 0. But it is actually a line in which the x-coordinate of all points is 0. x=0 is a line whose distance from the y-axis is 0.