Question
Question: How do you graph the line containing the given pair of points and find the slope \( \left( {1,5} \ri...
How do you graph the line containing the given pair of points and find the slope (1,5) (−6,−5) ?
Solution
Hint : To solve this question, we will first obtain the equation of line by using the given two points. After this, we will compare the equation with the standard equation of line. This will give us the value for the slope and the y intercept of the line. Finally by using the two points and y intercept, we can graph the line.
Complete step by step solution:
We know that when two points (x1,y1) and (x2,y2) are given, the equation of the line passing through it can be obtained by using the formula:
x−x1y−y1=x2−x1y2−y1
Here, we are given two points (1,5) and (−6,−5) .
Therefore, we can take (x1,y1)=(1,5) and (x2,y2)=(−6,−5) .
By putting these value in the formula, we get
Thus, the equation of the line passing through the given points is y=710x+725.
Now, we will compare this equation with the standard equation of the line.
The standard equation of line is : y=mx+c , where, m is the slope of the line and c is the y intercept of the line.
By comparing y=710x+725 with y=mx+c , we get m=710 and c=725 .
Thus, the slope of the line passing through the two given points is 710 .
Now, we can plot the graph of the line using these information as:
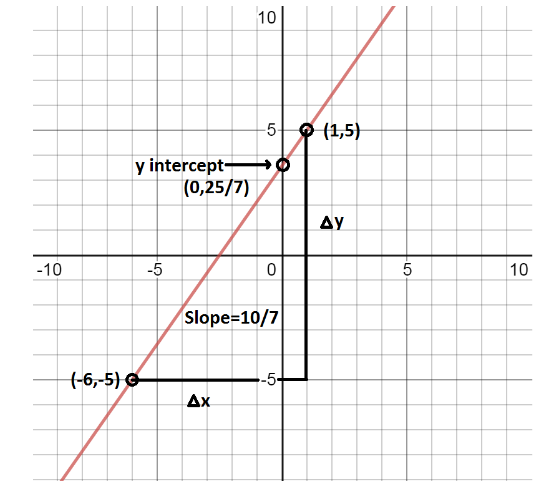
Note : Here, we have obtained the slope of the line by comparing its equation with the standard line. However, when we know any two points on the line, we can determine its slope by taking the ratio of difference in y coordinates to the difference in x coordinates of the given points.
For example:
m=x2−x1y2−y1=−6−1−5−5=−7−10=710