Question
Question: How do you graph the inequality \(y< {{x}^{2}}?\)...
How do you graph the inequality y<x2?
Solution
We will draw the graph for the function y=x2. Since the function we need to graph is y<x2, we will consider the area below the curve of the function y=x2. Since the inequality is ‘strictly less than,’ the graph will not include the points in the curve y=x2.
Complete step by step solution:
Let us consider the given inequality y<x2.
We are asked to draw the graph of this inequality.
Let us follow the following steps to draw the graph of the inequality.
We will first draw the graph for the function y=x2.
We need to find two or three points that satisfy the equation y=x2.
When the value of x=0, the value of y=0.
Therefore, let us note that the point (0,0) satisfies the equation y=x2.
If the value of x=1, then the value of y=1.
We can mark a dot at the point (1,1) for it is included in the curve of the function y=x2.
Now, let us find another point that is in the curve of the above equation.
When x=2, we will get y=4.
We will draw this curve using the dotted lines, because the points in the curve y=x2 are not included in the graph of the inequality y<x2 for the relation is ‘strictly less than.’
We will get a parabola with dotted lines. The required area is below the parabola.
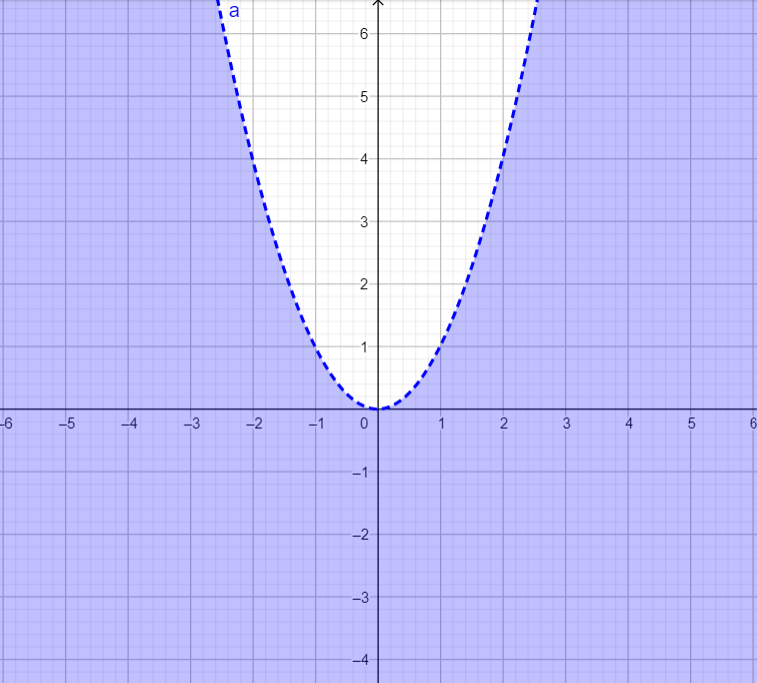
Therefore, the graph of the inequality y<x2 includes the points below the parabola y=x2. Hence the graph is the shaded area.
Note: Suppose that the value of x=3 and y=16. The point (3,16) is not point in the graph of y<x2 for 9<16. Similarly (2,4) is not a point in the graph, because y=x2.