Question
Question: How do you graph the inequality \[y\underline{>}\dfrac{3}{2}x-3\]?...
How do you graph the inequality y>23x−3?
Solution
Suppose an equation of straight line to be y=ax+b. We can draw the graph of y=ax+b from the simple graph y=x. We need to modify the y=x graph by shifting and scaling methods. It is a better idea to modify the graph of y=x in such a manner that we get the required graph by going from left side to right side of the equation y=23x−3.
Complete step by step answer:
As per the given question, we need to graph a straight line which is given by the equation y=23x−3.
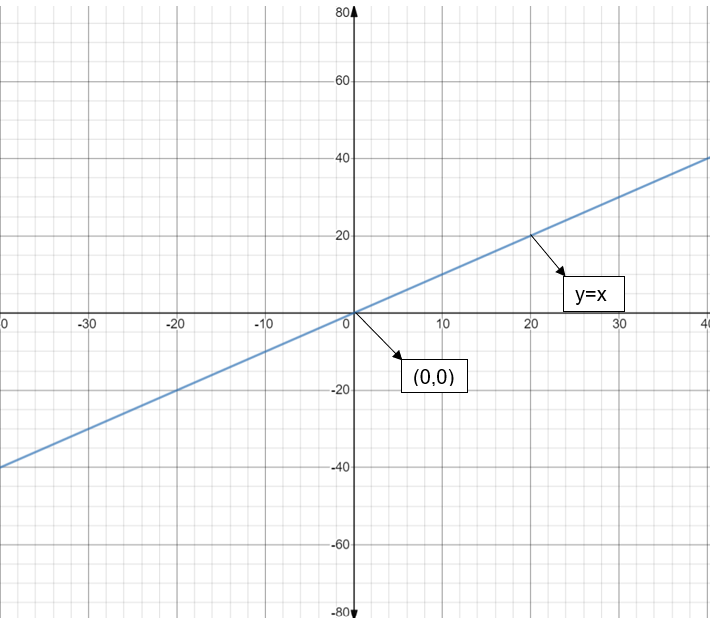
A straight line can be traced out on the cartesian plane by just two points lying on it. We can also use a third point for sort of check. It is very simple to graph the y=x line as it is symmetric to both x and y axes.
The graph of y=x is as shown in below figure:
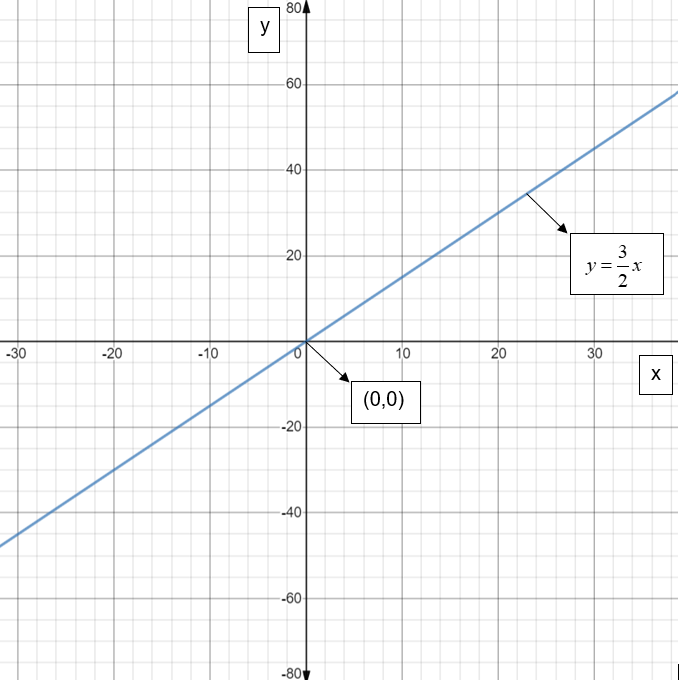
If we go from left hand side to right hand side of the equation y=23x−3, it is clear that we need to first scale the y=x graph by a factor 23. Then we get y=23x.
And the graph of y=23x is as shown in the below figure:
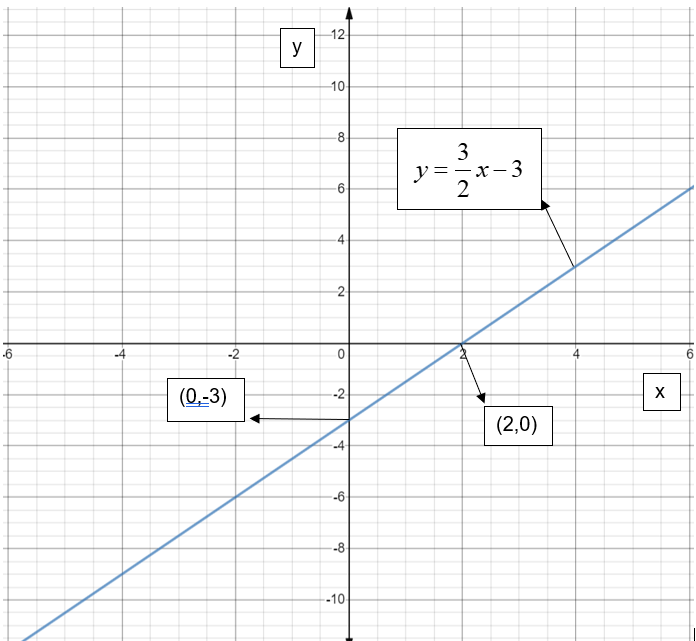
Now, we need to shift the y=23x graph right hand side by 3 units to get the required straight line y=23x−3. And the graph of y=23x−3 is shown in the below figure:
Since we need to plot y>23x−3 we have to shade the part above the line. Thus, it looks like,
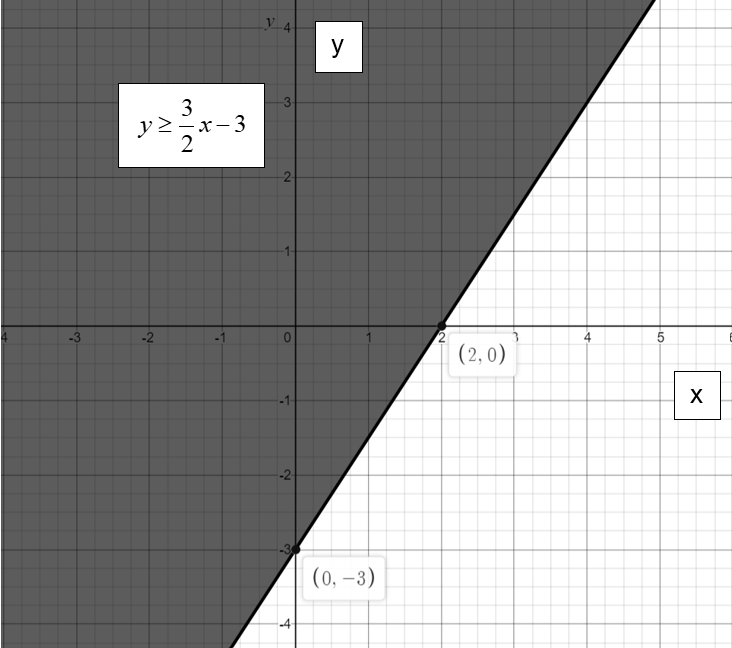
∴ we have to compress y=x by 23 and then shift it to the right hand side by 3 units and shade the part above the line to get the desired plot y>23x−3.
Note:
We can trace the graph of y>23x−3 by substitution by any two random values of x and joining the two random variables with a line. we have to check which part to be shaded depending on the sign given in the problem.