Question
Question: How do you graph the inequality \(y\le 4x-1\)?...
How do you graph the inequality y≤4x−1?
Solution
In this problem we need to draw off the given inequality. For this we need to first draw the graph of the equality. In this problem we have the inequality y≤4x−1. Now the equality of the above inequality will become as y=4x−1. Now we will draw the graph of the equation y=4x−1 calculating the intercepts of the equation. We know that intercepts are the points where the given line meets the coordinate axis. To calculate intercepts, we will substitute x=0, y=0 in the given equation and we will calculate the remaining variable value. After calculating the intercept points, we will join them to get the graph of the line y=4x−1. But we need to draw the graph of inequality y≤4x−1. In the inequality we have less than symbols so we will shade the area which is under the line y=4x−1 and that will be our required graph.
Complete step-by-step solution:
Given inequality y≤4x−1.
Considering the equation y=4x−1.
Substituting x=0 in the above equation, then we will have
y=4(0)−1⇒y=−1
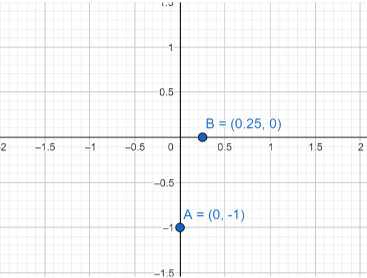
So, the point (0,−1) is the x−intercept.
Substituting y=0 in the above equation, then we will get
0=4x−1⇒4x=1⇒x=41
So, the point (41,0) is the y−intercept.
Plotting the two points in a graph paper, then we will get
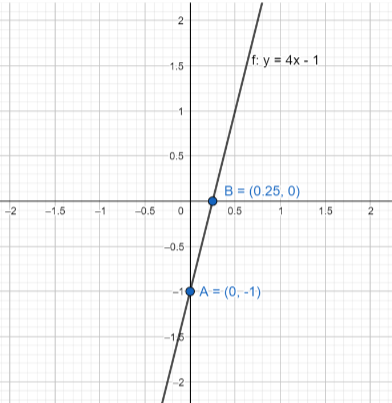
Joining the two points, then we will get the graph of the line y=4x−1 as
Now the graph of the inequality y≤4x−1 will be the area under the line y=4x−1. So, we are going to shade the area under the line y=4x−1 to show a graph of the inequality y≤4x−1.
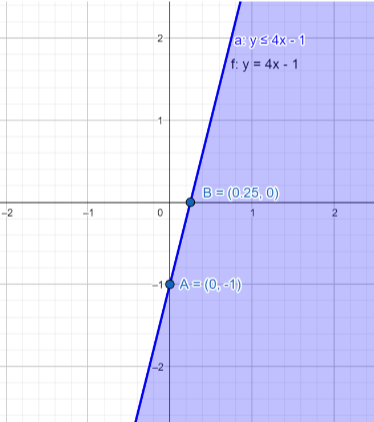
Note: In this problem they have asked to draw the inequality y≤4x−1. So, we have shaded the area which is under the line y=4x−1. If they asked to draw the inequality y≥4x−1, then we will shade the area which is above the line y=4x−1.