Question
Question: How do you graph the inequality \(y \geqslant 2x\) and \(y \leqslant - x + 2\)?...
How do you graph the inequality y⩾2x and y⩽−x+2?
Solution
To solve this question, we need to draw two straight lines from the given inequalities. After that, as the first inequality is of greater than and equal to, we need to shade the area above the first line. Similarly, as the second inequality is of less than and equal to, we need to shade the area below the second line. The cross section of both the areas will be our required graph for given inequalities.
Complete step by step answer:
We are given the first inequalityy⩾2x. For that we have to first draw the line y=2x.
If we compare this equation with the standard equation of line y=mx+c, we get the slope or the gradient m=2and y=intercept c=0. Thus we will draw this line and label it.
Now, as this inequality is of greater than and equal to, we will shade the area above this line.
We will now do the similar process for the second inequality which is y⩽−x+2.
If we compare this equation with the standard equation of line y=mx+c, we get the slope or the gradient m=−1and y=intercept c=2. Thus we will draw this line and label it.
Now, as this inequality is of less than and equal to, we will shade the area below this line.
Finally, the cross section area of both the shaded portion will be our required graph which is as shown In the figure below:
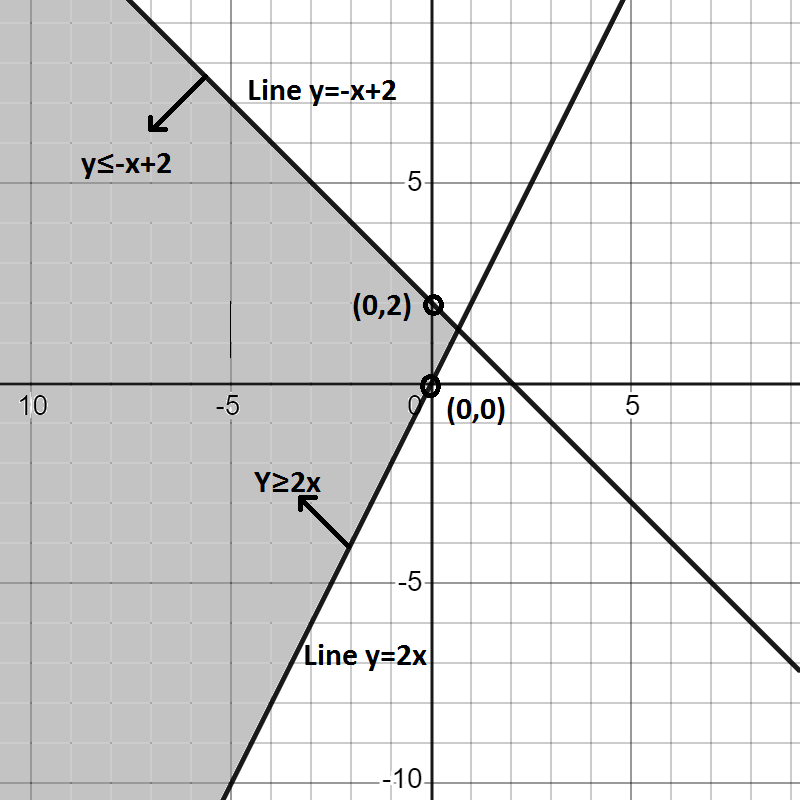
Note: Whenever this type of question is given, we should remember to draw the simple graph first without inequality. After that according to the type of inequality, we can shade the areas. And finally the common shaded area will represent the required graph as we have done in this question.