Question
Question: How do you graph the inequality \(y\ge 6\) on the coordinate plane ?...
How do you graph the inequality y≥6 on the coordinate plane ?
Solution
y≥6 means y should always be greater than or equal to 6, in the Cartesian plane we have to mark the region in which the y coordinate of all points should be less than or equal to 6. We should not get one point such that the y coordinate of the point is less than 5.
Complete answer:
The given inequalities is y≥6
To mark the region y≥6 first we have to draw the graph of y=6 , this graph will be a straight line parallel to X axis and passes through (0,6)
The upper side of graph will be the region where the y coordinate will always greater than 6
And the upper side of the straight line and the straight line will be the region where the y coordinate of all point will always less than or equal to 6
So our required region is on the straight line and upper side of straight line y=6
So let’s draw the region y≥6
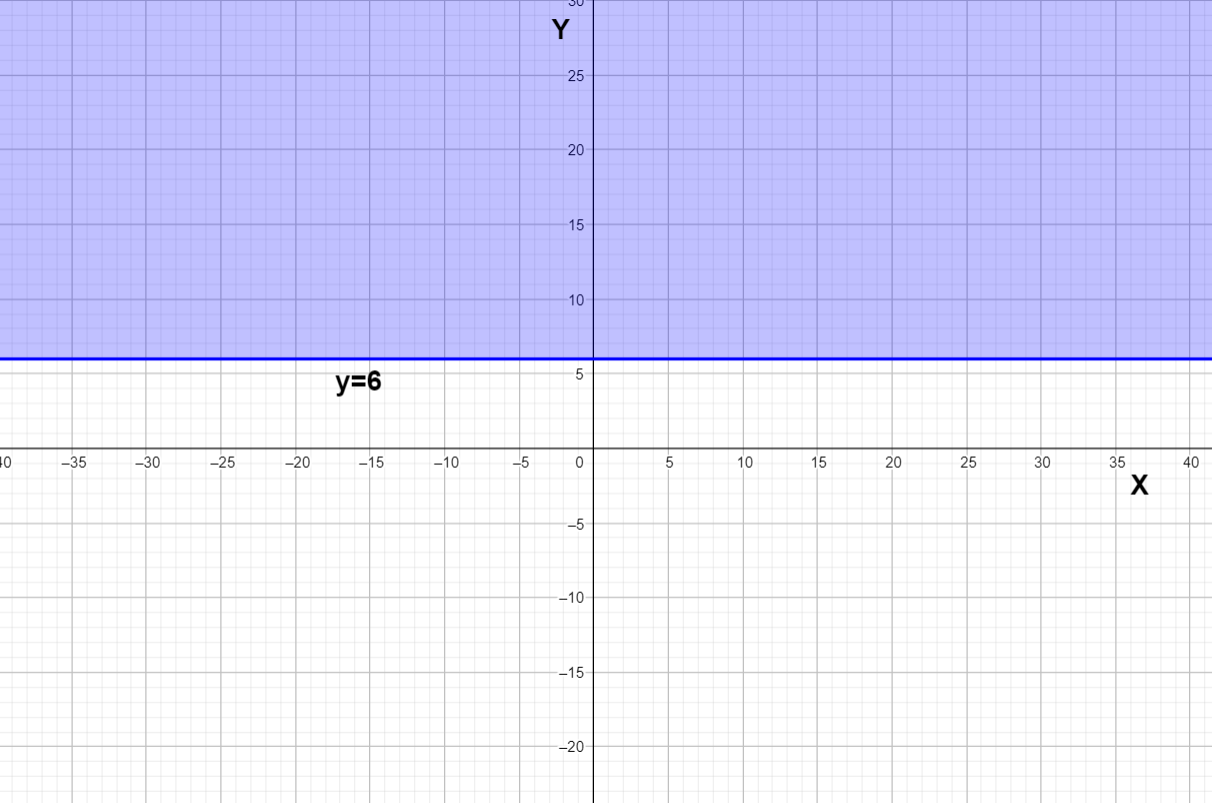
We can see the blue region is the graph of inequality y≥6
Note: Always note the inequality sign whether it is greater than or greater than equal to for example while drawing the graph of y>6 we will exclude all points on the line y=6, at the same time we will include all the points on the line y=6 while drawing the graph of y≥6.