Question
Question: How do you graph the inequality \(y\ge -4\)?...
How do you graph the inequality y≥−4?
Solution
As per the question, we are asked to plot the equation of inequality in which we need to sketch the graph by taking the equality instead of inequality and then shade the region to sketch the inequality portion as per asked in the question.
Complete step-by-step solution:
In the given question, we are given an inequality which we are being asked to plot. The given inequality is y≥−4. So, in this question firstly we will take the equality of inequality as mentioned in the hind which is y=−4 and then we will shade the asked region such that y is greater than -4.
In this while we will plot y=−4 we will get a line parallel to x-axis passing. Now, after plotting the line what we can see is that we need to plot all those points such that y is -4 or greater than -4. When we will shade this then we will notice that the whole first and second quadrant of the plot would be shaded above the line and also the third quadrant and fourth quadrant some portion above the line y=−4 .
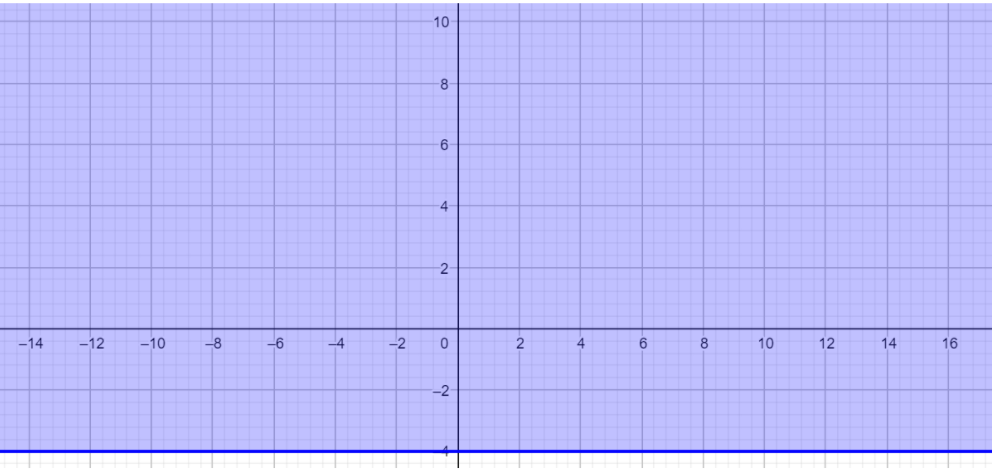
Hence, the plot we get is as shown above.
Note: The asked question is easy although we sometimes make the very common mistake that we forget to remove the inequality sign in order to plot the boundary line and get confused there. Next, after doing this we forget to mark the shaded region in order to plot the inequality also.