Question
Question: How do you graph the inequality \[y<\dfrac{2}{3}x+3\]?...
How do you graph the inequality y<32x+3?
Solution
To solve this problem we have known both equality and inequality concepts to draw the graph. First we have to draw the graph of the equality function first and then we have to shade the part of the graph either greater or lesser side according to the inequality given.
Complete step by step answer:
Let us know the steps we have to follow to solve the inequality functions.
First we have to rearrange the equations in such a way that only terms containing y should be present there on RHS side and the remaining terms has to be on LHS side
We have to plot the equality line of the given inequality i.e., y=” “line
Now we have to shade the part of the graph above or below the line drawn according to inequality given.
If the inequality given is “>” then we have to shade the above part of the line.
If the inequality given is “<” then we have to shade the below part of the line.
If the given inequality is ≤ or ≥ then we draw a solid line otherwise we have to draw a dashed line.
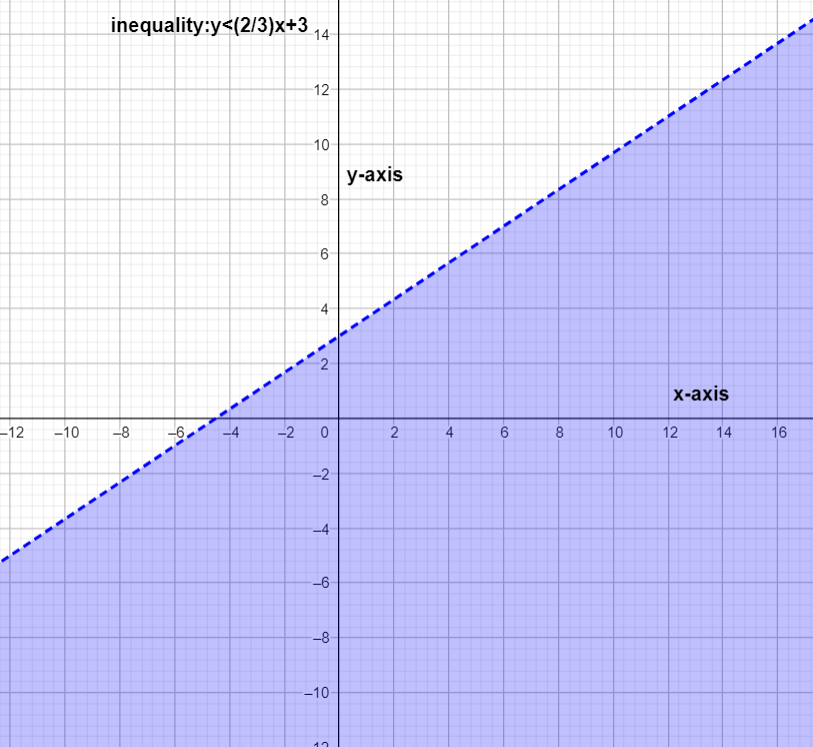
Now we will draw the graph for the equation given y<32x+3
This equation is already arranged accordingly with like terms. So no need to rearrange the equation.
Here it is only < so we have to draw a dashed line.
First we have to draw the line for y=32x+3.
After that we had to shade the below part of the line as it is <
The graph will look like
Note:
In this we can have special cases which are parallel to x-axis and y-axis. The line parallel to x-axis will not contain y term in it and the line parallel to y-axis will not contain x term in it. While drawing the graph we have to be careful about the dashed line or solid line to draw.