Question
Question: How do you graph the inequality \[y < 3\]?...
How do you graph the inequality y<3?
Solution
Take reference from the graph of the function y=3. This will be a straight horizontal line parallel to x−axis and 3 units above the origin. The entire region lying above the line y=3 will represent the graph of y>3 and the entire region lying below the line y=3 will represent the graph of y<3.
Complete step by step answer:
According to the question, we have to show how to draw the graph of inequality y<3.
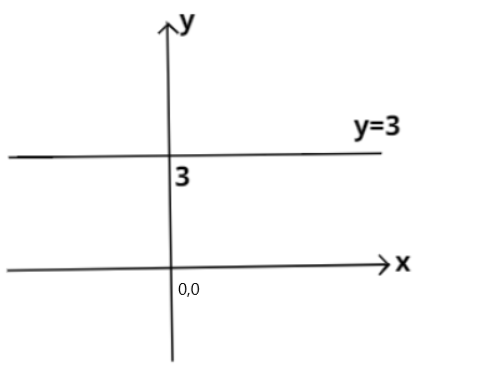
To understand the nature of the graph of inequality y<3 we will take reference from the graph of the function y=3. So we’ll first draw the graph of this function.
We already know that the graph of this function i.e. y=3 will be a straight line parallel to x−axis and lying 3 units above the origin. This is shown below:
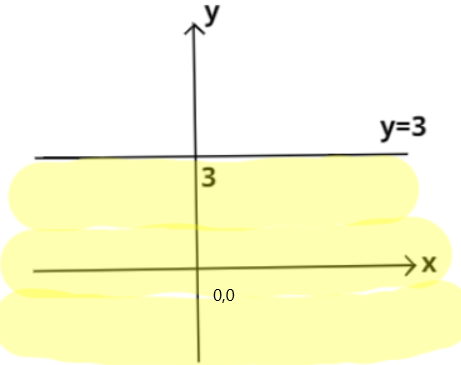
Now, we have to show the graph of inequality y<3. This means that the region where the value of y is less than 3 units will be included in the graph. And we know that the value of y is less than 3 for all the points lying below the straight line shown in the above graph
From this, we can conclude that the entire region lying below the straight line shown in the above graph i.e. y=3 will be the region showing inequality y<3. This is shown below as the shaded region.
Note: In the similar way as above, if we have to represent the graph of inequality y>3 then this will be the entire region lying above the straight line y=3.
One important point to consider here is that the line y=3 will not be included in the graphs of inequalities y<3 and y>3. However, if we are representing the graphs of y⩽3 and y⩾3 then we have to include the line y=3 in graphs.