Question
Question: How do you graph the inequality \[2x + y \leqslant 6\] on the coordinate plane ?...
How do you graph the inequality 2x+y⩽6 on the coordinate plane ?
Solution
First we need to draw the graph of the equation 2x+y=6. We use intercept form to draw the graph. That is we find the coordinate of the given equation lying on the line of x- axis, we can find this by substituting the value of ‘y’ is equal to zero (x-intercept). Similarly we can find the coordinate of the equation lying on the line of y- axis, we can find this by substituting the value of ‘x’ equal to zero (y-intercept). After drawing the graph we can check in which region the inequality satisfies.
Complete step by step answer:
Given, 2x+y⩽6. Now consider 2x+y=6. To find the x-intercept. That is the value of ‘x’ aty=0. Substituting this in the given equation. We have,
2x+0=6
⇒2x=6
Divide by 2 on both side,
x=26
⇒x=3
Thus we have a coordinate of the equation which lies on the line of x-axis. The coordinate is (3,0). To find the y-intercept. That is the value of ‘y’ at x=0. Substituting this in the given equation we have,
2(0)+y=6
⇒y=6
Thus we have a coordinate of the equation which lies on the line of y-axis. The coordinate is (0,6). Thus we have the coordinates (3,0) and (0,6). Let’s plot a graph for these coordinates. We take scale x-axis= 1 unit = 1 units and y-axis= 1 unit = 1 units.
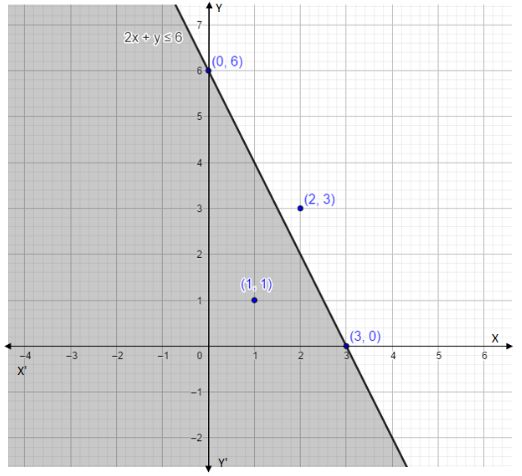
We expanded the point touching the intercepts. We took a coordinate above and below the equation of line (see in above graph).
That is (x,y)=(2,3) and now put it in the inequality,
2(2)+(3)⩽6
4+3⩽6
⇒7⩽6. Which is wrong.
Now take a coordinate below the equation of line,
That is (x,y)=(1,1)
2(1)+1⩽6
2+1⩽6
⇒3⩽6. Which is true.
In the above graph the shaded region is the solution of the given inequality.
Note: If we take any coordinate point below the line of the graph, the inequality satisfies. Also if we take a point on the line, the inequality will be satisfied. A graph shows the relation between two variable quantities, it contains two axes perpendicular to each other namely the x-axis and the y-axis. Each variable is measured along one of the axes. In the question, we are given one linear equation containing two variables namely x and y, x is measured along the x-axis and y is measured along the y-axis while tracing the given equations.