Question
Question: How do you graph the inequality \[2x > - 6\] and \[x - 4 < 3\] ?...
How do you graph the inequality 2x>−6 and x−4<3 ?
Solution
We simplify the given inequality. Then we draw the graph for a simplified equation. We use intercept form to draw the graph. That is we find the coordinate of the given equation lying on the line of x- axis, we can find this by substituting the value of ‘y’ is equal to zero (x-intercept). Similarly we can find the coordinate of the equation lying on the line of y- axis, we can find this by substituting the value of ‘x’ equal to zero (y-intercept). After drawing the graph we can check in which region the inequality satisfies. We will have a two line parallel to the y-axis.
Complete step by step answer:
Given, 2x>−6 and x−4<3.
Now 2x>−6
Divide the whole inequality by 2,
x>−26
⇒x>−3.
Now take x−4<3
Add 4 on both side of the inequality,
x−4+4<3+4
⇒x<7
Now we draw the graph for x=−3 and x=7. For x=−3 we don’t have a variable ‘y’. So whatever the values we give for ‘y’, the value of ‘x’ will be −3. Thus the coordinates are (−3,1),(−3,2)(−3,3)(−3,−1)(−3,−2) and so on. For x=7 we don’t have a variable ‘y’. So whatever the values we give for ‘y’, the value of ‘x’ will be 7. Thus the coordinates are (7,1),(7,2)(7,3)(7,−1)(7,−2) and so on.Let’s plot a graph for these coordinates. We take scale x-axis= 1 unit = 1 units and y-axis= 1 unit = 1 units.
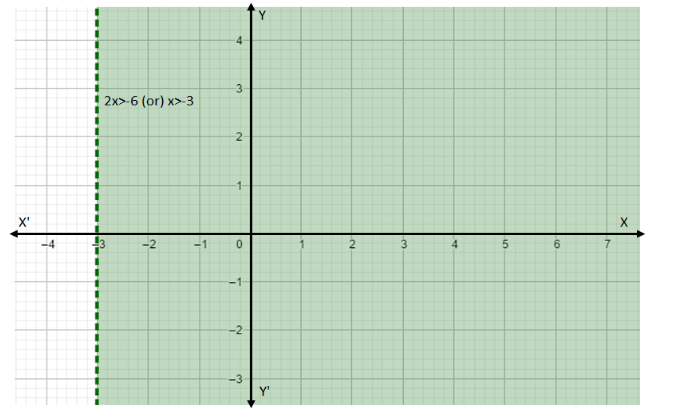
In the above graph the shaded region is the solution of 2x>−6. Also if we take a point lying on the line x=−3 the inequality 2x>−6 is not satisfied.
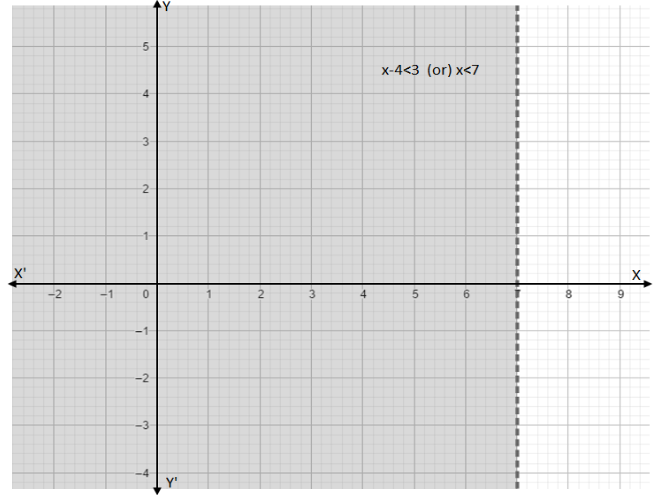
In the above graph the shaded region is the solution of x−4<3. Also if we take a point lying on the line x=7 the inequality x−4<3 is not satisfied. In the above graph the shaded region is the solution of the given inequality.
Note: A graph shows the relation between two variable quantities, it contains two axes perpendicular to each other namely the x-axis and the y-axis. Each variable is measured along one of the axes. In the question, we are given one linear equation containing two variables namely x and y, x is measured along the x-axis and y is measured along the y-axis while tracing the given equations.