Question
Question: How do you graph the inequalities \[x \geqslant 4\] or \[x > - 4\] ?...
How do you graph the inequalities x⩾4 or x>−4 ?
Solution
Here we find the equation of equality in both the cases of inequalities and use the concept that when we have x-axis equal to the value then we include the line and when there is no equality included we only take area after or before the line.
Complete step by step solution:
We will graph the two inequalities separately.
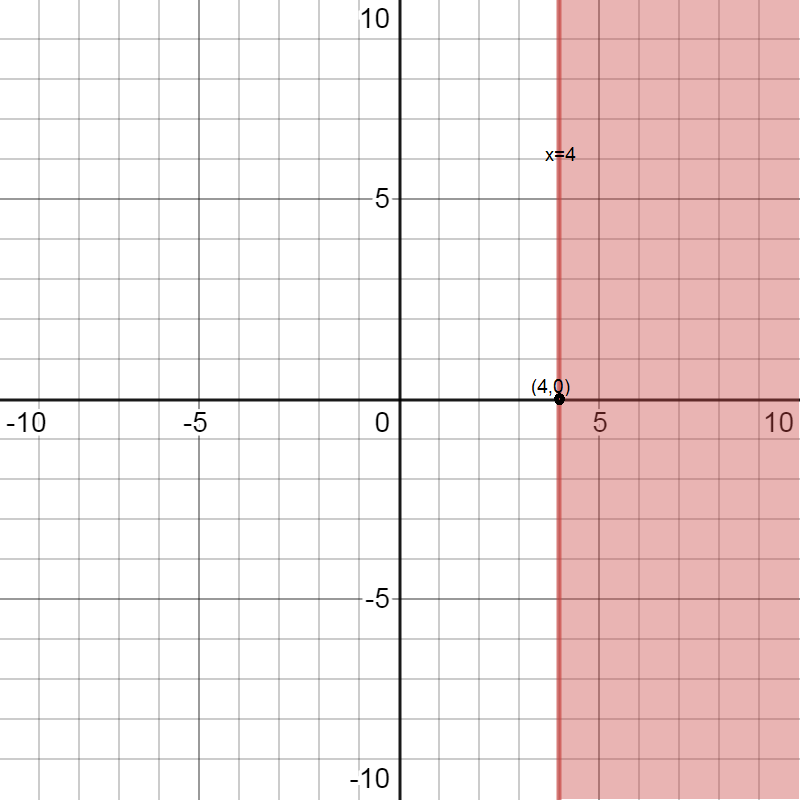
We are given the inequality x⩾4 … (1)
We first find equality of the line by removing the inequality.
The equation of line will be x=4
Now we will draw the line on the graph and shade all the areas that are greater than the line. Here the value of x is greater than or equal to 4, so we will include the line as well.
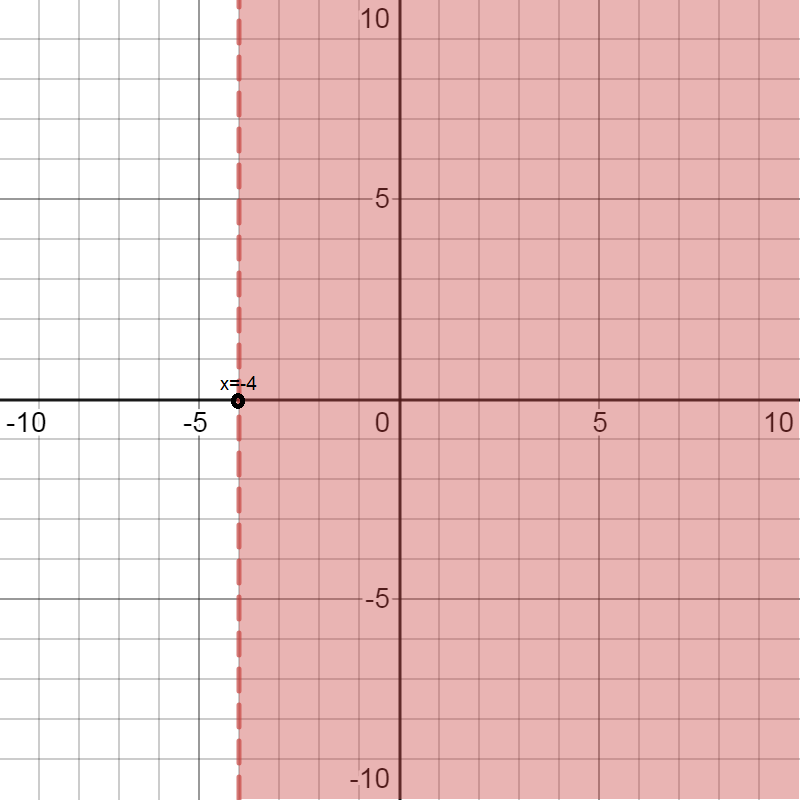
We are given the inequality x>−4 … (2)
We first find equality of the line by removing the inequality.
The equation of line will be x=−4
Now we will draw the line on the graph and shade all the areas that are greater than the line. Here the value of x is greater than -4, so we will not include the line.
Note: Many students make the mistake of shading the area on the left hand side in the second inequality as they think that numerical values on the left in the negative number line part are greater. Keep in mind that on the number line the values decrease as we move towards left and the values increase as we move towards the right. So, we have to take greater part than the equation of line, so we shade the area on the right hand side of the line.