Question
Question: How do you graph the function \(y=x-1?\)...
How do you graph the function y=x−1?
Solution
First we will take some numbers randomly as x values to graph the function. And then we will substitute those numbers for x in the given function to find the corresponding y values. So, we will get as many points as the x values taken.
Complete step by step solution:
Let us consider the given function y=x−1.
We are asked to graph the given function. To graph the function, we need to find the coordinate points (x,y) that satisfy the function when substituted for the respective variables.
In the expression, we can see that the value of y changes according to the value of x. So, the variable x is independent and the variable y is dependent. Therefore, we are free to choose two or three numbers randomly for the variable x.And we will get corresponding y values.
We are going to choose the numbers 0,1 and 2 as x values.
Using these values, we are going to find the y values we need.
When we substitute 0 in the place of x in y=x−1, we will get y=0−1=−1.
When we substitute x=1 in the given function, we will get y=1−1=0.
And when we substitute x=2, that will give us y=2−1=1.
So, the three points we have found in order to graph the given function are (0,−1),(1,0) and (2,1).
We can plot the graph using these points.
Hence the graph of the function y=x−1 is obtained as
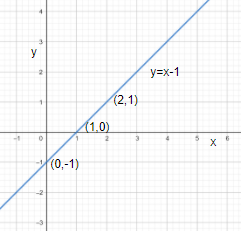
Note: When we draw a graph, we need to mark at least two points through which the required curve passes on the plane. When we join these two points, we will get the required curve.