Question
Question: How do you graph the function y = arctan(x)?...
How do you graph the function y = arctan(x)?
Solution
In the above question, we were asked to graph the function y = arctan(x). Also, arctan(x) is a one-to-one function. We will solve arctan(x) in the range of −2π,2π . We need to show the graph of arctan(x) as well. So, let us see how we can solve this problem.
Complete step-by-step answer:
In the given problem we have to find the function of y = arctan(x). We will note that we will be assuming a variable x which will be equal to arctan(tan(x)). So, we will create a table of typical x and tan(x) values and then we will notify the labels.
| x in degrees | tan(x) | arctan(x) in degrees | x |
|---|---|---|---|
| -90 | −∞ | -90 | −∞ |
| -60 | −3 | -60 | −3 |
| -45 | -1 | -45 | -1 |
| -30 | −31 | -30 | −31 |
| 0 | 0 | 0 | 0 |
| 30 | 31 | 30 | 31 |
| 45 | 1 | 45 | 1 |
| 60 | 3 | 60 | 3 |
| 90 | +∞ | 90 | +∞ |
Now, we will plot the arctan(x) and it should look like this.
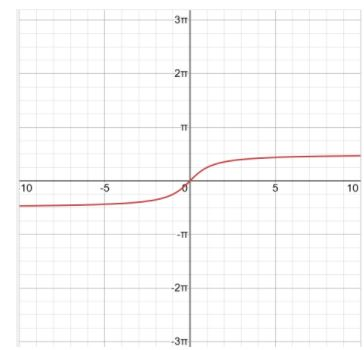
Note: In the above solution, we first find the value of arctan(x) where x = -90 to +90, and then we plot the graph for those values of arctan(x). In the graph, the y-intercept is the degree of arctan. We should note arctan(x) is a one-to-one function.