Question
Question: How do you graph the function \(y = 5\)?...
How do you graph the function y=5?
Solution
A graph is a visual diagram used to represent equations or functions or any statistical information through lines or curves. To plot a graph for an equation, we must know the coordinates of the graph. Coordinates of the graph can be found by assuming certain values for either x or y in the given equation and then finding out the value of another variable with the help of the first.
We must know that the function given in the question is a constant function. A constant function is a type of function whose output value is the same for every input value. It has the form of y=c where c is a constant. Here for y=5, since whatever be the value of x, the value of y will be 5 only.
Complete Step by Step Solution:
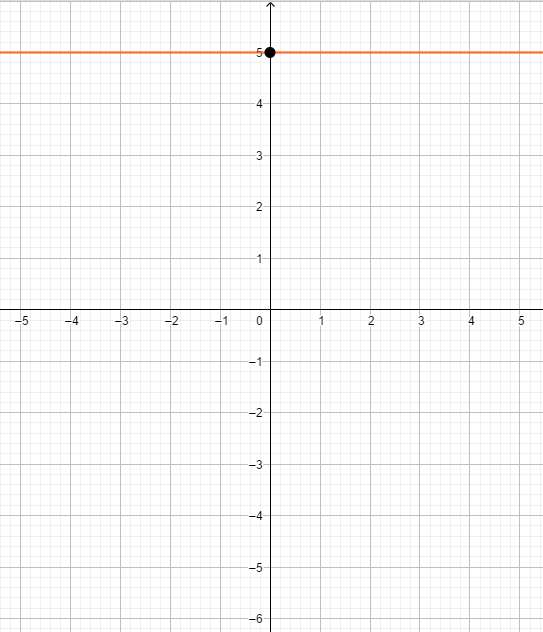
The given equation for which the graph shall be plotted is y=5. Since whatever be the value of x, the value of y will only be 5. Therefore the coordinates of the graph for y=5 will be in the form of (x,5) where x can assume any value.
Hence, the graph will be a horizontal line passing through the y-axis which will be at a distance of 5 units from the origin (0,0). The coordinates of the point at which the graph will intersect the y-axis are (0,4)as the value of x coordinates on the y-axis are 0.
With the help of all the information, we can plot the required graph as given below:
Note:
It is fascinating to know that the graph of both the x-axis and y-axis can also be defined. The graph of y-axis is expressed as x=0 whereas the graph of x-axis is expressed as y=0.