Question
Question: How do you graph the function \(y = - 3{x^2} + 2\) ?...
How do you graph the function y=−3x2+2 ?
Solution
For graphing the function, first we have to check the function is in standard form or not.
After attaining the standard form, we have to obtain the values from which we can ensure whether the graph opens upward or downward. After that consider x=0 and find the coordinate (x,y) of the vertex. Then by equating y=0 we can find the value of x by which we can graph the function.
Complete step by step answer:
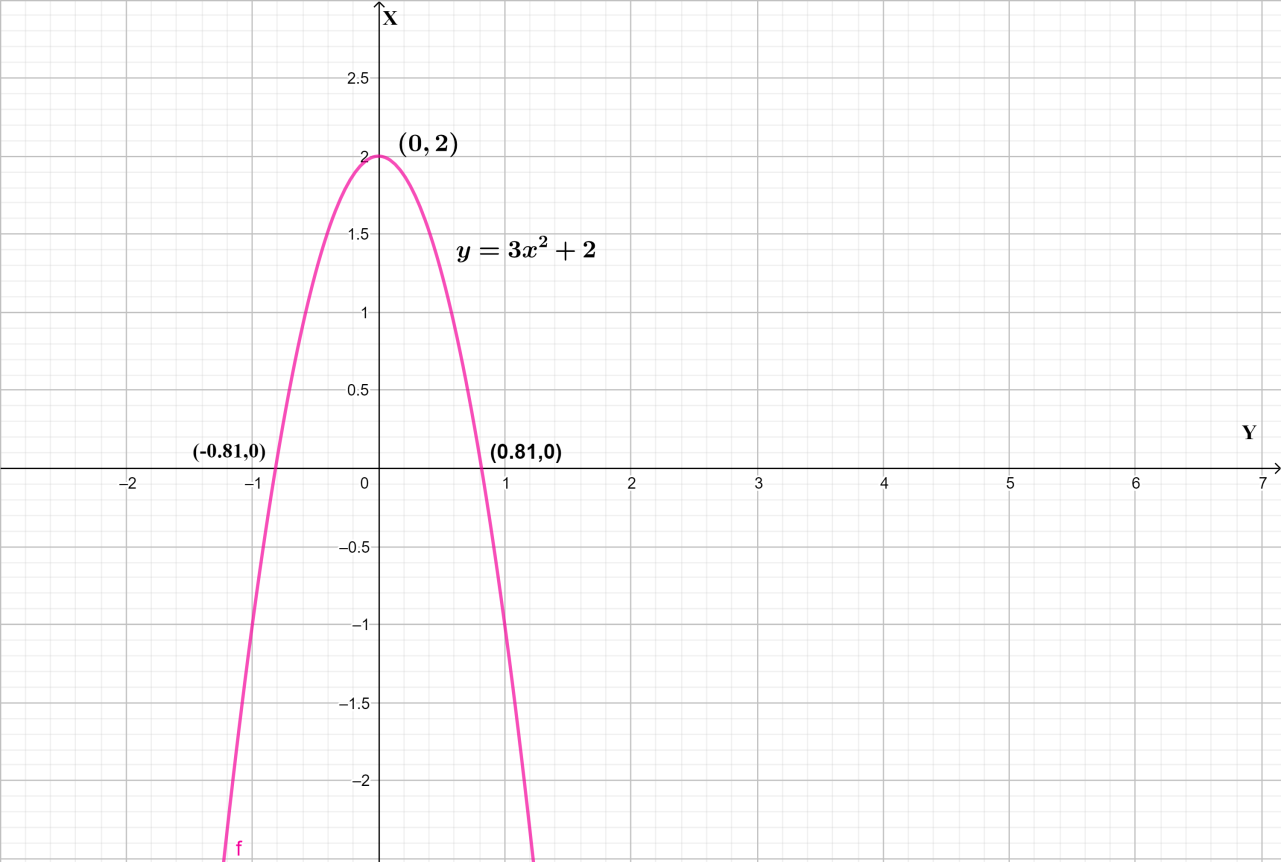
The given function is y=−3x2+2
The equation is in the form of y=Ax2+Bx+C which is in standard form.
On comparing them, we get
A=−3 ,B=0 and C=2
Since A is negative, the graph opens downward.
Vertex is the lowest point on the graph.
The x coordinate of the vertex occurs at 2A−B x=(2(−3)0)=0
To find the y coordinate, we substitute x=0 and solve for y
y=(−3(0)2+2)=2
The vertex is at (0,2) the lowest point on the graph
Now to find the x coordinate, we can consider y=0
Therefore we get,
⇒0=(−3x2+2)
∴−3x2=−2
Now minus on both sides will get cancel
⇒3x2=2
Bringing 3 to the right side, we get
⇒x2=32
Then taking the square roots we will get
⇒x=±32
Therefore we have two values of x
i)x1=+32=0.81
ii)x2=−32=−0.81
Now by plotting the graph we get a Parabola for the function y=−3x2+2
Note: Descriptions of graphs:
| "The graph is positive" | means that the y values of the graph are positive. | |
|---|---|---|
| "The graph is negative" | means that the y values of the graph are negative. | |
| "The graph is increasing" | means that as we move from left to right the y values on the graph climb. | |
| "The graph is decreasing" | means that as we move from left to right the y values on the graph drop. |