Question
Question: How do you graph the function \(y = - 2x\) ?...
How do you graph the function y=−2x ?
Solution
The above problem is on the concept of drawing graphs from the given equation.a
Graph of a function f is a set of ordered pairs of function f(x) = y, where y is a function of x.
Using the above definition of graph we will plot the graph of the given equation.
Complete step-by-step solution:
Let’s discuss the graph in more detail first and then we will do the plotting by calculating the values of y.
Graph is a set of ordered pairs, where f(x) = y is a function of x. If we put different values of x, we will get each value of y against x .Likewise we will get the plot of y against x on the x – y plane.
Now, we will calculate the values of y against x and make the table for it. We will calculate 4 values of y.
| X | 0 | 1 | 2 | 3 |
|---|---|---|---|---|
| Y | 0 | -2 | -4 | -6 |
We have obtained the values on positive x axis and negative y axis.
Let’s explain the table;
In equation, y=−2x
If we put x = 0 , y = 0,
When x = 1, - 2,
When x = 2, y = -4 , x = 3, y = -6
Now we will plot the values of x and y on the x – y plane.
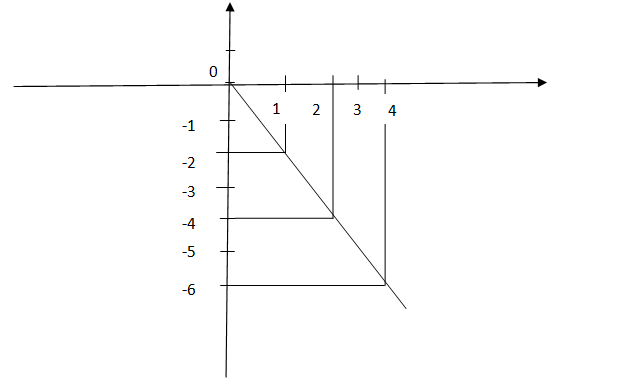
We have plotted the graph on the x and y axis and obtained the linear graph which is in the fourth quadrant of the graph.
Note: Graphs are not only used to represent mathematical equations but also used for the flow of computation, Graphs are used to represent networks of communication, Graphs are used to represent data organisation, graphs are also used to find the shortest path in a network.