Question
Question: How do you graph the function \[f(x)=|2x+3|\]?...
How do you graph the function f(x)=∣2x+3∣?
Solution
We are given a linear function which is of the form y=mx+c. So, if we compare y=mx+c with the function given to us we will get the slope as 2, the y – intercept as 3. To graph the given equation, we need coordinates. So, we will put x=0 first and then get the value of y. Next, we will put f(x)=0 and get the value of x. so, we will have points and will plot these points on the graph. Therefore, we will have the graph of the given expression.
Complete step by step solution:
According to the given question, we have a linear function given to us and which we have to graph. We can see that the given function is of the form, y=mx+c. If we compare the given expression with this, we can write that slope, m=2 and the y – intercept as, c=3.
The expression given to us is,
f(x)=∣2x+3∣----(1)
We are asked to graph this linear function, so for that we will have to find coordinates to be plotted.
We can first take x=0 and get the value of y – coordinate. So, we will have one coordinate, that is,
For x=0, we get,
⇒f(x)=y=∣2(0)+3∣
We get the value of the y-coordinate as
⇒y=∣0+3∣=3
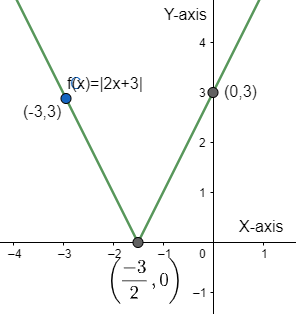
The coordinate we get is, (0,3).
Similarly, we will put f(x)=y=0, so the x – coordinate we get is,
∣2x+3∣=0
Now, we write the expression in terms of x, we get,
⇒2x=−3
⇒x=2−3
The coordinate we get is, (2−3,0).
Also, for x=−3
We get the value of the y – coordinate as,
y=∣2(−3)+3∣
⇒y=∣−6+3∣=∣−3∣=3
The coordinate we get is, (−3,3)
Note: The coordinates for the graph should be carefully found, substituting the values correctly. Calculations, if any, should be done step wise or terms can be missed or overlooked and this might lead to wrong graphs being drawn.