Question
Question: How do you graph the function \(f\left( x \right)=\dfrac{1}{2x+1}\)?...
How do you graph the function f(x)=2x+11?
Solution
We first explain the curve for the rectangular hyperbola. Then we place the values and different signs for x and y coordinates in the function y=2x+11. We tried to find the characteristics for the graph and then plot the graph.
Complete step by step answer:
The given equation of f(x)=2x+11 is an example of rectangular hyperbola.
A hyperbola for which the asymptotes are perpendicular, also called an equilateral hyperbola or right hyperbola. This occurs when the semimajor and semi minor axes are equal. This corresponds to taking, giving eccentricity.
We can find the graph of the hyperbola using the values separately.
We can take y=f(x)=2x+11.
We take the variables and the constants on different sides of the equality.
We try to find the signs for the x and y coordinates.
We take x<−21 which gives y<0. Similarly, if we take x>−21, then that will give y>0.
Now we try to find the values for x and y coordinates.
If the value of x increases, the value of y decreases because of the inverse relation.
Similarly, if the value of y increases, the value of x decreases.
The value of y can never be 0. The limiting values will be 0 for y.
Now we based on the information, draw the graph.
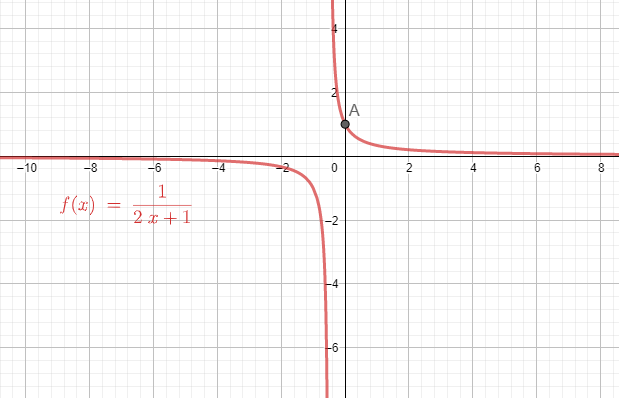
Note: We need to remember that the limiting values for the function y=f(x)=2x+11.
The value of y in the function y=f(x)=2x+11 tends to 0 as x→±∞. The intersection of the curve y=f(x)=2x+11 with the Y-axis is the only point of A≡(0,1).