Question
Question: How do you graph the function \(f\left( x \right)=2x\) ?...
How do you graph the function f(x)=2x ?
Solution
Problems of this type can be easily solved by converting the function into a simple coordinate geometrical equation first, as y=2x . After that we select two x values, and plug them into the equation to find the corresponding y values. Now, we plot the two points on graph paper and connect them using a line, which will be the graph of the given function.
Complete step by step answer:
The given function we have is
f(x)=2x
We rewrite this function in the form of an equation,
⇒y=2x
As, this is an equation of a straight line and we know that any line can be graphed connecting two points. We have to select two x values, and plug them into the equation to find the corresponding y values.
We now choose 0 to substitute in for in for x to find the ordered pair. Replacing the variable x with 0 in the expression, we get
⇒f(0)=2⋅0
⇒f(0)=0
⇒y=0
Hence, for x=0 we get 0 as the y value.
Again, we replace the variable x with 5 in the expression, as
⇒f(5)=2⋅5
⇒f(5)=10
⇒y=10
Hence, for x=5 we get 10 as the y value.
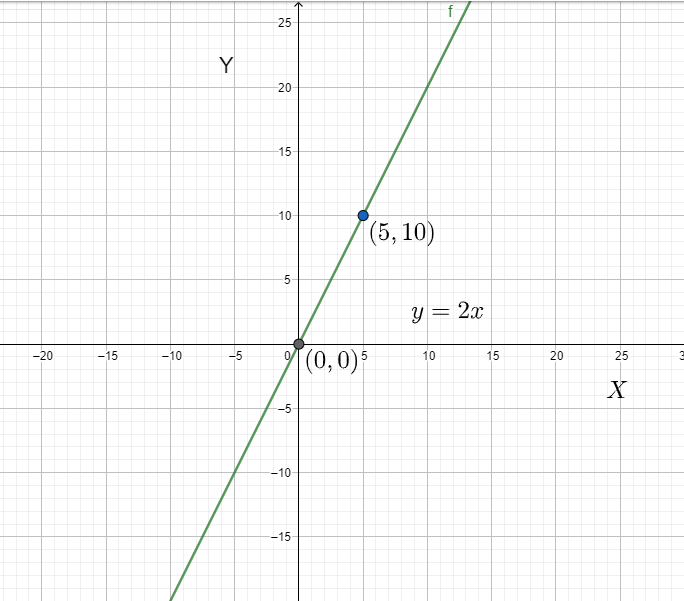
We get the coordinates of the two points (0,0) and (5,10)
Now, connecting the two points we get the graph of the line, y=2x
Therefore, we graph the line by connecting the points (0,0) and (5,10) .
Note:
Instead of connecting two points to get the line we can also graph the function by comparing the equation with the general straight-line equation, y=mx+c . Hence, the slope we get is 2 and the y intercept is 0 . As the line has zero y intercept using a protractor at the origin to draw the angle of the corresponding slope, we will be able to plot the function f(x)=2x on graph paper.