Question
Question: How do you graph the function \(f\left( x \right)=-4\) ?...
How do you graph the function f(x)=−4 ?
Solution
Try to find the slope and y-intercept by comparing with slope intercept form i.e. y=mx+c. Try to plot the graph by taking different values of ‘x’ for the same value of y (since you will get a constant function so it’s ‘y’ value will be constant.)
Complete step-by-step answer:
As we know f(x)=y,
So, the function f(x) can be written in equation form as y=−4
Slope intercept form: We know a general straight line has an equation in the form y=mx+c, where ‘m’ is the slope and ‘c’ is the intercept with the y-axis.
Now our equation y=−4 can be written as y=0x+(−4)
So by comparing it with the slope intercept form y=mx+c, we get
m=0 and c=−4
Since it has a slope =0 so it is a constant which never changes and intercepts the y-axis at the point −4.
And since this is a constant function so for every value of ‘x’ there is always the same value of ‘y’ i.e. −4.
Now for the graph part, we have the constant value of y=−4 and we can take the value of x as anything say 1,2,3…
So, graph can be drawn as follows
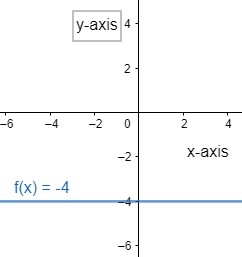
From the above graph we can conclude that f(x)=−4 is a straight line passing through the point (0,−4) and parallel to the x-axis.
Note: The form of the given equation should be compared with slope point form to get the nature of the graph. Graphs should be drawn by taking different ‘x’ values for a constant ‘y’ value i.e. −4.