Question
Question: How do you graph the equation \(y = \dfrac{1}{2}x + 2\) ?...
How do you graph the equation y=21x+2 ?
Solution
Find the slope and y-intercept by using the slope-intercept formula which is y=mx+b. Then, by using the two values for x, find the corresponding values for y and form the table which gives the value for x and y - intercept both.
Complete Step by Step Solution:
The equation given in the question is y=21x+2. We have to draw this equation in the graph.
Therefore, to find the slope and y-intercept of the equation we have to use the slope-intercept formula –
y=mx+b
where m is the slope and b is the intercept.
Therefore, comparing equation y=21x+2 with y=mx+b , we get –
m=21 and b=2
Any line can be graphed using two points. Select two values for x and then put them into the equation given in the question to find the corresponding values for y.
Therefore, choose 0 in the place of x to find the corresponding value of y. Putting x=0 in the given equation, we get –
⇒y=20+2 ⇒y=2
Hence, when x=0 then, y=2
Now, we can put 2 in the place of x and then find the corresponding value of y -
⇒y=22+2 ⇒y=1+2 ⇒y=3
Hence, when x=2 then, the value of y is 3.
Now, creating the table using both the values of x and y. As the values of x and y are (0,2) and (2,3).
| x | y |
|---|---|
| 0 | 2 |
| 2 | 3 |
We can then plot these points in the coordinate plane.
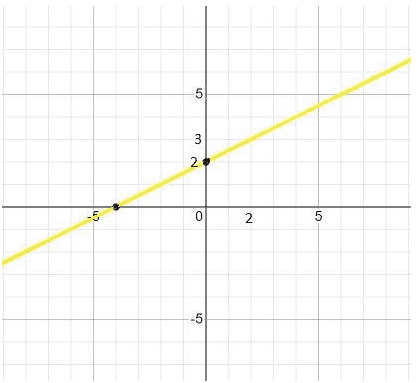
The above graph best shows the equation y=21x+2.
Note:
When we plot the graph for slope-intercept form equation then we get the straight line. The slope in this equation represents the steepness of the line. It can also be termed as gradient descent. By putting the values for x we can easily get the values of y in slope-intercept form.