Question
Question: How do you graph the equation \[y = 4x - 1\]?...
How do you graph the equation y=4x−1?
Solution
To solve this we need to give the values of ‘x’ and we can find the values of ‘y’. Otherwise we can find the coordinate of the given equation lying on the line of x- axis, we can find this by substituting the value of ‘y’ is equal to zero (x-intercept). Similarly we can find the coordinate of the equation lying on the line of y- axis, we can find this by substituting the value of ‘x’ equal to zero (y-intercept).
Complete step by step solution:
Given, y=4x−1.
To find the x-intercept. That is the value of ‘x’ aty=0. Substituting this in the given equation. We have,
⇒0=4x−1
⇒4x=1
Dividing by 4 on both sides,
⇒x=41
⇒x=0.25.
Thus we have a coordinate of the equation which lies on the line of x-axis. The coordinate is (0.25,0).
To find the y-intercept. That is the value of ‘y’ at x=0. Substituting this in the given equation we have,
⇒y=4x−1
⇒y=4(−1)−1
⇒y=−1.
Thus we have a coordinate of the equation which lies on the line of the y-axis. The coordinate is (0,−1).
Hence we have coordinates (0.25,0) and (0,−1)
Let’s plot a graph for this coordinates,
We take scale x-axis= 1 unit = 0.2 units , y-axis= 1 unit = 0.2 units
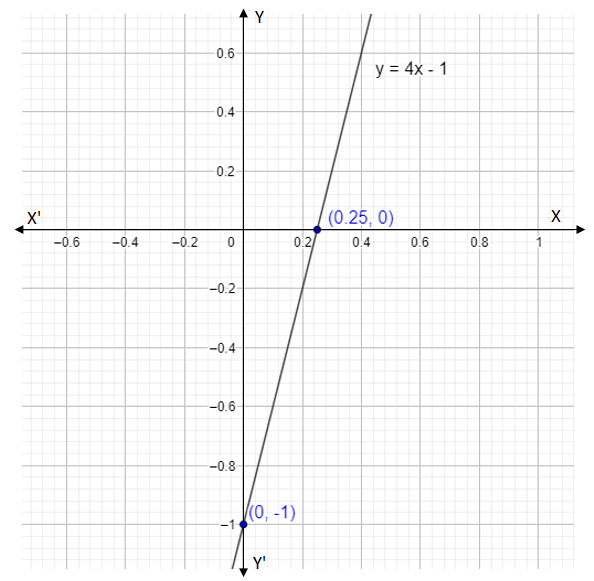
All we did is expand the line touching the coordinates (0.25,0) and (0,−1) by a straight line.
Note: Since we have a decimal number in x-intercept, to draw the graph more accurately we found out a few more coordinates. A graph shows the relation between two variable quantities, it contains two axes perpendicular to each other namely the x-axis and the y-axis. Each variable is measured along one of the axes. In the question, we are given one linear equation containing two variables namely x and y, x is measured along the x-axis and y is measured along the y-axis while tracing the given equations.