Question
Question: How do you graph the equation \[y = - 4\] by making a table and what is its domain and range?...
How do you graph the equation y=−4 by making a table and what is its domain and range?
Solution
Here, the value of y is constant, so we will select some arbitrary values of x to find the different coordinate points. To do this, we will make a table consisting of values of x and corresponding values of y. Then, we will draw the graph of the equation using the points and then find the domain and range.
Complete step by step solution:
The equation given to us is y=−4. We have to graph this equation and find its domain and range. Let us assume f(x)=y=−4.
Let us take x=0. We get y=−4.
If we take x=−4, we get y=−4 again. So, no matter what value of x we take, we will always get the value of y as y=−4. Let us form a table and graph the equation y=−4 using the table.
| x | f(x)=y |
|---|---|
| −4 | −4 |
| 0 | −4 |
| 3 | −4 |
So, we get the points as A(−4,−4), B(0,−4) and C(3,−4). Now we will draw the graph by plotting these points
We get the graph as follows:
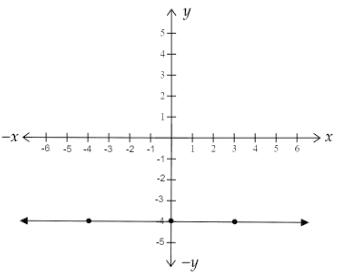
We can see from the above graph that the graph of f(x) is a horizontal line passing through the point y=−4. This is because the function f is a constant function.
Now, let us find the domain and range of the function f.
The domain of a function f is the set of all inputs of the function. In the given function, we consider all real numbers as inputs. So, the domain is the entire real line R=(−∞,∞)
The range of a function f is the set of all outputs of the function. In the given function, we have only one output which is −4. So, the range is −4.
Note:
A constant function is defined a function f:R→R, where f(x)=c, for all x∈R and c is a constant. The graph of a constant function will be a line parallel to the x−axis. It lies above the x− axis if c is positive, below the x− axis if c is negative and coincident with the x− axis if c is zero. In the given problem, c=−4 which is negative and so, we get a line below the x− axis.