Question
Question: How do you graph the equation by plotting \(y = - 1.5x - 2\)?...
How do you graph the equation by plotting y=−1.5x−2?
Solution
The given equation is the equation of a line in a two dimensional plane which is also called as the coordinate plane.We know this from the fact that the equation of a line is a linear equation in both xand y. The above equation fulfills this condition; we can easily tell this is an equation of a line. The next part of the question is to plot the line on the graph. The easiest method is to find the value of intercepts on the coordinate axis which will then give us two points through which our line will pass. The line will then be plotted on a graph using those points by joining those two points and since a line passing through any two given points is unique we will get our line from plotting the graph.
Complete step by step answer:
The given line will be plotted by first finding out the point of intersection of the given line on the coordinate axis. The solution for that will be found by first putting the value of x as zero and then subsequently putting the value of y as zero.Putting x as zero we get,
y=−2
Thus the yintercept is (0,−2) similarly solving for
y=0
we get
x=−1.52
⇒x=−34
Thus x intercept is given as (−34,0). The given line will now be plotted the diagram of plotting is shown below
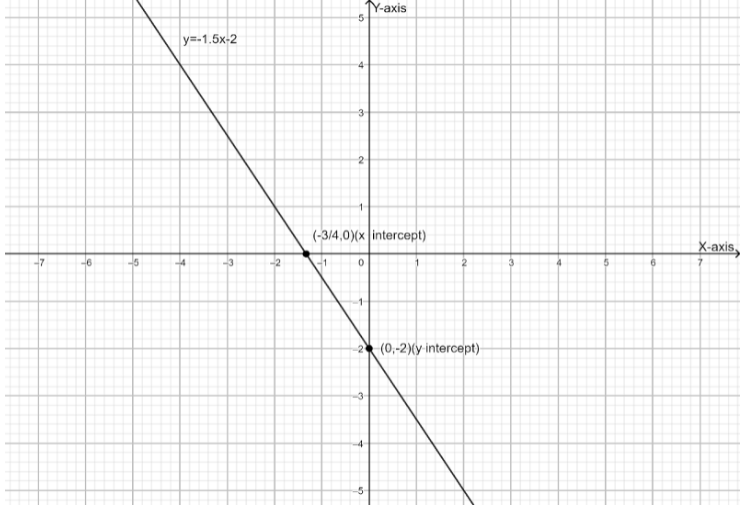
The given line is thus plotted on the graph.
Note: Remember that whenever a linear equation is given in a question which is of two variables x and y we should consider it to be the equation of a line and solve the question accordingly. The slope intercept form of the line is given by the formula y=mx+c, where m is the slope and the term c is the y-intercept of the line.