Question
Question: How do you graph the equation by plotting points \(3x-2y=15\)?...
How do you graph the equation by plotting points 3x−2y=15?
Solution
To plot a graph we need to find the change that occurs in the dependent variable y w.r.t. the independent variable x. We can simply plug in any value of x and obtain the value of y or we can do the other way round i.e. plug the values of y and obtain the value of x. Both ways, we are going to obtain an ordered pair and putting that on the axes and joining the lines or the curve we will obtain the graph of the equation.
Complete step by step solution:
We first observe that the curve given to us is that of a straight line because both the dependent and the independent variables are in linear power. Moreover, we use the fact that for any two points on the axes, there is only a unique line that passes through them. So, it suffices to find any two points that lie on this line and joining those points we can easily say that the graph has been obtained.
We start by finding two points on the line. The simplest trick is to plug the value 0 one by one. So we first put the independent variable equal to 0. So, put x=0, we get:
3×0−2y=15
⟹−2y=15
⟹y=−215
So, we obtain the coordinate (0,−215)
Next, we put y=0, and we get:
3×x−2×0=15
⟹3x=15
⟹x=5
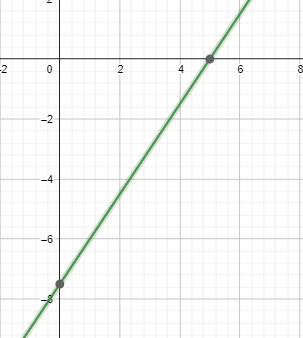
Hence, the next coordinate obtained is (5,0)
Plotting this we obtain the following graph of the given equation:
Note:
You can also find some more points on the line and cross check whether they lie on the line or not. This way you would be able to find the answer more accurately since you will have double checked the answer. Moreover, if the points are not lying on a single line then you need to see any calculation mistake that you might have made.