Question
Question: How do you graph \[\tan \left( \left( \dfrac{1}{2} \right)x \right)\]?...
How do you graph tan((21)x)?
Solution
We draw this graph using tangent function concepts. Here we will find the period, intercept, asymptotes and domain using the formulas we have in tangent functions. By using all these factors we will draw the graph of the given equation accordingly.
Complete step by step answer:
Before we proceed we have to know about the tangent function.
The equation that was given to us in the form of f(θ)=y=tankθ
So we should know how to calculate the factors required for this function.
The calculation of factors for this function can be done using the below formulas:
Period=∣k∣π
X-scale = 2Period
Domain = The domain of branch is \left\\{ \theta :-\dfrac{{{90}^{\circ }}}{k} < \theta < \dfrac{{{90}^{\circ }}}{k} \right\\} because f(θ) is undefined between θ=−k90∘ and θ=k90∘.
Range = (−∞,∞).
The asymptotes of this type of function is undefined.
So using these formulas we can solve our question and draw the graph.
Let us find these factors for the angle given to us
Given angle is tan((21)x)
So the factors are
K=21
Now the period is
Period= ∣k∣π
⇒21π
⇒2π
So the period is 2π
Now the x-scale is
X-scale= 2Period
⇒22π
⇒π
Y-scale can be anything because its intercept is always 0
So the x-scale is π
Range: (−∞,∞)
Domain: \left\\{ \theta :-\dfrac{{{90}^{\circ }}}{k} < \theta < \dfrac{{{90}^{\circ }}}{k} \right\\}
\Rightarrow \left\\{ \theta :-\dfrac{{{90}^{\circ }}}{\dfrac{1}{2}} < \theta < \dfrac{{{90}^{\circ }}}{\dfrac{1}{2}} \right\\}
\Rightarrow \left\\{ \theta :-{{180}^{\circ }} < \theta < {{180}^{\circ }} \right\\}
So the domain is between −180∘ and 180∘.
Now using these factors we are going to draw the graph
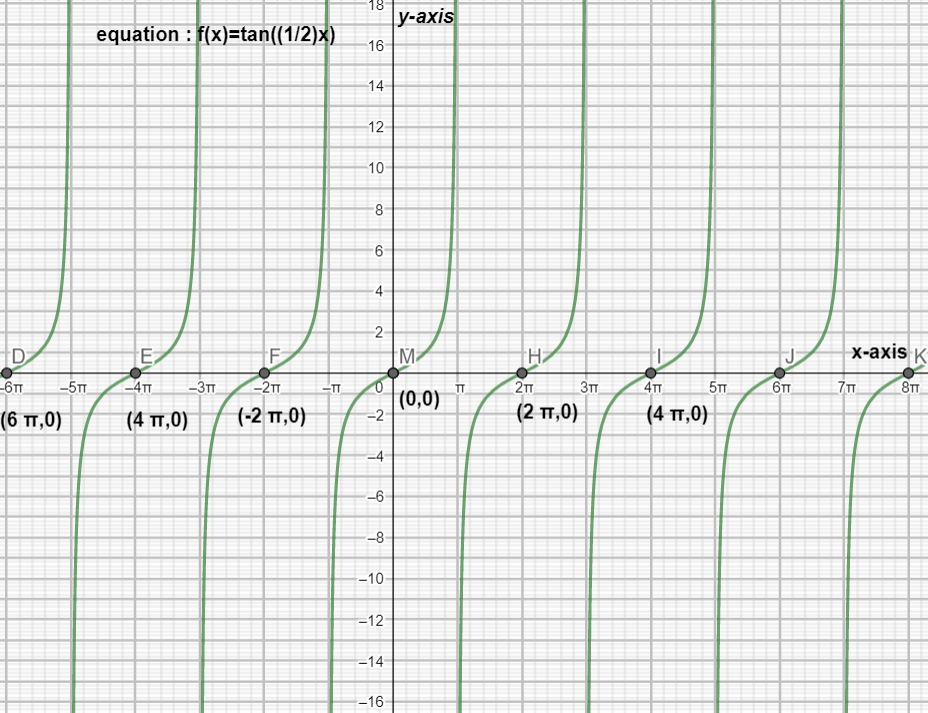
So, here is the graph formed for the given angle using the above factors.
Note:
While drawing the graph we have to be sure about the x and y scale accordingly. Also we have to make sure that calculating the factors is also very important for drawing these graphs.