Question
Question: How do you graph \[\tan \left( {\dfrac{x}{2}} \right) + 1\]?...
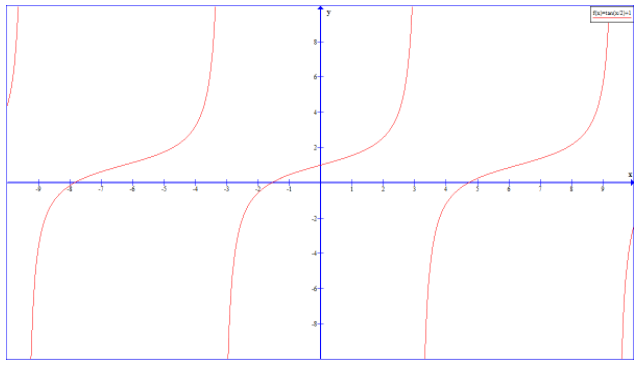
How do you graph tan(2x)+1?
Solution
To graph the tangent function, we mark the angle along the horizontal x axis, and for each angle, we put the tangent of that angle on the vertical y-axis and the curve obtained is positive infinity in one direction and negative infinity in the other.
Complete step by step solution:
To graph the function tan(2x)+1, as we know the shape of the tangent curve is the same for each full rotation of the angle and so the function is called 'periodic'.
And we must know a few points before sketching the graph.
The constant +1 in the function represents how much the graph is to be raised. We can find the period which are the lengths at which the function repeats itself, in which tan(x) has a period of π, so that tan(2x) has a period of 2π, since the angle is divided by 2 in the function given andtan(x) is undefined when cos(x)=0 and is zero when sin(x)=0 because
tan(x)=cos(x)sin(x).
In the graph we can see that the function has vertical asymptotes at π intervals so the period is π and when x=0,y=0.
So, if you have tanx+1 it shifts all the y values up by one tan(x2)is a vertical shift and it doubles the period to 2π.
Note:
To sketch the trigonometry graphs of the functions – Sine, Cosine and Tangent, we need to know the period, phase, amplitude, maximum and minimum turning points. Hence based on this we can graph the derivative of a function. And the tangent function has a range that goes from positive infinity to negative infinity.