Question
Question: How do you graph \(r=\theta \) ?...
How do you graph r=θ ?
Solution
We know that (r,θ) are polar coordinates, where r is the distance between the point and origin and θ is the angle between the line joining the origin and the point on X-axis. We will start substituting the value of θ from zero and increase gradually to find the desired answer.
Complete step by step solution:
We have given an expression r=θ.
We have to plot a graph for the given equation.
Now, we know that (r,θ) are polar coordinates, where r is the distance between the point and origin and θ is the angle between the line joining the origin and the point on X-axis.
Now, we know that the value of θ starts from zero i.e. from origin and goes in the counter clockwise direction. The graph goes curved when the value of θ increases.
When the value of θ increases from 0 to 2π the graph goes in the counterclockwise direction and farther from the origin because the Cartesian coordinates will be
⇒x=rcosθ and y=rsinθ
When θ=2π we will get
⇒x=rcos2π and y=rsin2π
⇒x=2π×0 and y=2π×1
⇒x=0 and y=2π
So the graph intercepts the Y-axis at 2π.
Similarly when θ increases from to π the graph intercepts X-axis at π.
We will get the graph as
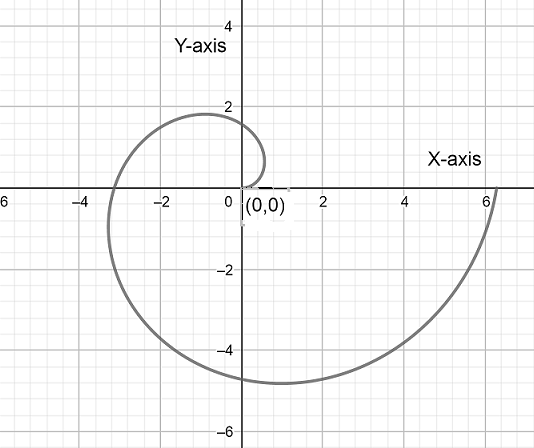
Hence above is the required graph of the given expression.
Note: To plot a graph first we need to find the values of Cartesian coordinates. Then by finding some values of points we will draw a graph. We need to write r and θ in terms of x and y to plot a graph in a Cartesian plane.