Question
Question: How do you graph \[r=\sqrt{\cos \left( 2\cdot \theta \right)}\]?...
How do you graph r=cos(2⋅θ)?
Solution
In this given question, we have been asked to plot the graph for a given polar form. The polar form of a complex number is the other way to represent a given complex number, the polar form is represented by z = a + bi. When we need to plot the points in the plane, we need to have rectangular coordinate i.e. (x, y). For conversion from polar coordinates to rectangular coordinates, we will need to use the formulas from trigonometric functions.
Complete step by step solution:
We have given that,
⇒r=cos(2⋅θ)
Writing the polar-coordinates, we get
To convert from polar coordinates to rectangular coordinates, using the formulas from trigonometric functions definitions:
We have,
x=r⋅cosθ And y=r⋅sinθ
So we have that,
r2=x2+y2
And by using trigonometric identity, i.e.
cos(2θ)=cos2θ−sin2θ
Again, we can write that;
As, x=r⋅cosθ, then ⇒cosθ=rx
And, y=r⋅sinθ, then ⇒sinθ=ry
Substituting the above values, we get
cos(2θ)=cos2θ−sin2θ=(rx)2−(ry)2
So, therefore
⇒r=cos(2⋅θ)
Transposing square root to the left side of the above expression, we get
⇒r2=cos(2⋅θ)
Substituting the value of cos(2θ) in the above expression, we get
⇒r2=(rx)2−(ry)2
Simplifying the above expression, we get
⇒r2=r2x2−y2
Multiply both the sides of the equation byr2, we get
⇒r4=x2−y2
Simplifying the exponents in the above expression, we get
⇒(r2)2=x2−y2
Substituting the value of r2=x2+y2 in the above expression, we get
⇒(x2+y2)2=x2−y2
Thus,
The graph of the equation(x2+y2)2=x2−y2;
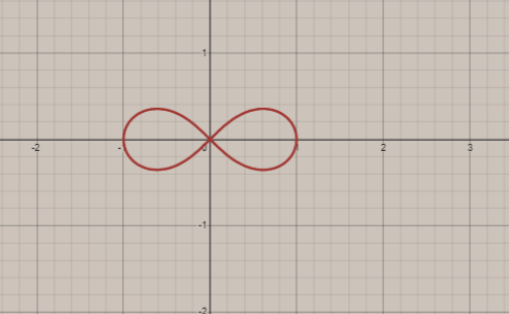
Hence, this is the required graph.
Note:
Students need to remember that polar coordinates are those coordinates that can be plotted into a circular grid. On the other side, rectangular coordinates are those coordinates that can be plotted into a plane i.e. graph and the rectangular coordinates are represented in the form of (x, y). Rectangular coordinates include only numerical values as they represent only horizontal axis and vertical axis.