Question
Question: How do you graph \(r = 1 - \sin \left( \theta \right)\) ?...
How do you graph r=1−sin(θ) ?
Solution
The given expression is r=1−sin(θ) which produces a cardioid. In the given expression r=1−sin(θ) try to substitute different values for θ and find the corresponding values of r and plot the graph for the same values.
Complete step by step answer:
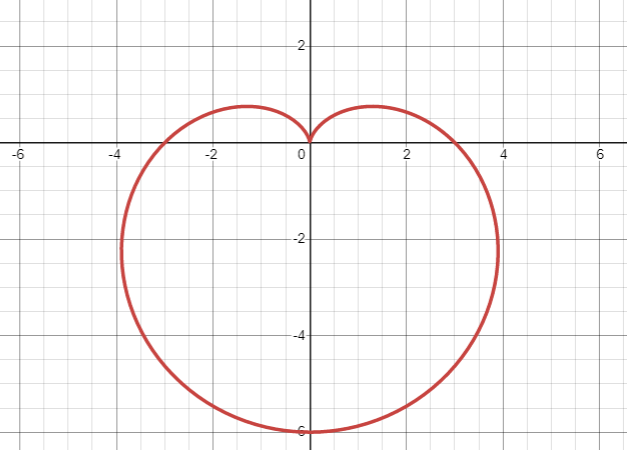
The given expression that is r=1−sin(θ) which is a polar coordinate produces the cardioid. Cardioid is nothing but a curve or a graph that somewhat looks like a heart-shaped curve.
The graph of a cardioid looks as shown below.
Now, to draw a graph for r=1−sin(θ) , try to substitute different values for θ which varies from 0 to 2π.
The below table gives us the values of sine function for different values:
\begin{array}{*{20}{c}}
\theta &{{0^ \circ }}&{{{30}^ \circ }}&{{{45}^ \circ }}&{{{60}^ \circ }}&{{{90}^ \circ }}&{{{180}^ \circ }}&{{{270}^ \circ }}&{{{360}^ \circ }} \\\
{\sin \theta }&0&{\dfrac{1}{2}}&{\dfrac{{\sqrt 2 }}{2}}&{\dfrac{1}{2}}&1&0&{ - 1}&0
\end{array}
Now we consider different values for θ to which we need to find the corresponding values of r .
So let θ=0 now to find the corresponding value of r we can write as below,
⇒r=1−sin(0∘)=1−0=1
At θ=30∘ the value of r is
⇒r=1−sin(30∘)=1−21=21
At θ=60∘ the value of r is
⇒r=1−sin(30∘)=1−21=21
At θ=90∘ the value of r we get as
⇒r=1−sin(90∘)=1−1=0
In the same way the values of r can be listed as below for different values of θ .