Question
Question: How do you graph \(\ln (|x|)\)?...
How do you graph ln(∣x∣)?
Solution
First we will understand the base by using the rule logex=lnx.
Then we will evaluate the x-intercept and the y-intercept and then accordingly mark points. Then we will finally plot the graph.
Complete step by step answer:
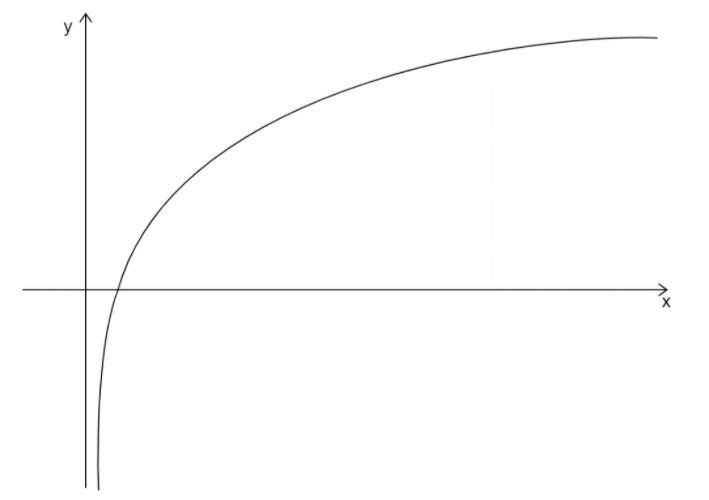
We will first start by using the properties of logarithms to graph f(x)=ln(∣x∣). Now here, the function ln(∣x∣) is a logarithmic function with base e which is an irrational number and has the value 2.17828.
Now, the x-intercept, or we can say the point where the graph crosses the x-axis of the graph, is (1,0). The y-axis is a vertical asymptote of the graph or in other words, the graph approaches the y-axis but does not touch it.
Now we will plot the graph.
Additional Information: A logarithm is the power to which a number must be raised in order to get some other number. Example: logab here, a is the base and b is the argument. Exponent is a symbol written above and to the right of a mathematical expression to indicate the operation of raising to a power. The symbol of the exponential symbol is e and has the value 2.17828. Remember that lna and loga are two different terms. In lna the base is e and in loga the base is 10. While rewriting an exponential equation in log form or a log equation in exponential form, it is helpful to remember that the base of exponent.
Note: Remember the logarithmic property precisely which is logex=lnx.
While comparing the terms, be cautious. After the application of property when you get the final answer, tress back the problem and see if it returns the same values. Evaluate the base and the argument carefully. Also, remember that lnee=1.