Question
Question: How do you graph \[\ln \left( -x \right)\]?...
How do you graph ln(−x)?
Solution
In the given question, we have been asked to plot the graph of a given logarithmic function. We need to graph the given logarithmic function using vertical asymptote and for that we need to set-up the given arguments equals to zero i.e. x = 0 and thus, the vertical asymptote occurs at x equals to zero.
Complete step by step solution:
We have given that,
ln(−x)
Le the function y=ln(−x)
Set up the given function of the logarithm equals to 0.
x=0
Thus,
The vertical asymptote occurs at x = 0.
Therefore, vertical asymptote: x = 0.
Now,
As we know that logarithmic functions are only defined at the positive values i.e. where the value of ‘x’ is greater than zero.
Therefore, for the given logarithmic function is only defined at the values which are less than zero i.e.,
x < 0.
Finding the points:
At x = -1
y=ln(−x)⇒y=ln(−(−1))⇒y=ln(1)=0
At x = -2
y=ln(−x)⇒y=ln(−(−2))⇒y=ln(2)=0.69
At x = -3
y=ln(−x)⇒y=ln(−(−3))⇒y=ln(3)=1.099
We got points to plot on the graph, i.e.
| x | Y |
|---|---|
| -1 | 0 |
| -2 | 0.69 |
| -3 | 1.099 |
Thus, graph of the given function;
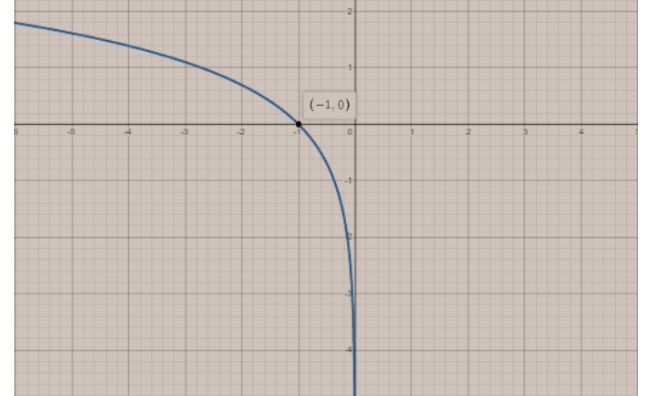
Hence, this is the required graph ofln(−x).
Note:
While plotting the graph of the logarithmic function, students need to remember that logarithmic functions are only defined at the positive values i.e. where the value of ‘x’ is greater than zero. Therefore, for the given logarithmic function is only defined at the values which are less than zero i.e.,
x < 0. Students need to be aware of the concepts of logarithm and exponent to avoid making errors.