Question
Question: How do you graph \(\ln \left( {x - 2} \right)\) ?...
How do you graph ln(x−2) ?
Solution
The question deals with the plotting a graph of the logarithmic function. First we will draw a graph of the simple y=lnx. We know that the value of simple logarithmic function is not defined for x=0. The simple logarithmic function at x=1 gives the zero value. So first we will find the point at which the given question is not defined and the given function is equal to one at x=2. The graph of simple logarithmic function y=lnx is similar to the exponential function y=ax. Therefore we will first draw the graph of a simple logarithmic function y=lnx and then we will shift it by two units downward, which will be the graph of the given logarithmic function. We can also draw the graph by alternative method. The given problem can be also solved by substituting the different values of x in the function and then finding the respective value of the function.
Complete step by step solution:
Step: 1 the given logarithmic function is,
ln(x−2)
Compare the given logarithmic function with simple log function y=lnx. If we replace x by x−2 in the simple logarithmic function, then we will find the graph of the given function.
As we can see that the value of the given logarithmic function at x=2 is not defined.
⇒y=ln(2−2) ⇒y=ln0
Step: 2 If we substitute x=3 in the given logarithmic function then,
⇒y=ln(x−2) ⇒y=ln(3−2) ⇒=ln1 ⇒y=0
The logarithmic function is not defined for zero and negative values.
To plot the graph of a given function, first plot the graph of lnx and then shift it by two units downward.
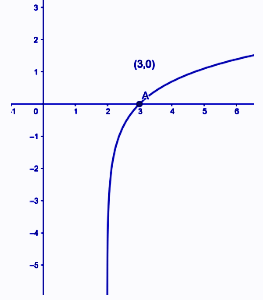
Therefore the graph of the given function can be plotted as shown.
Note:
First draw the graph of simple logarithmic function and then shift it by two units downward. Then the graph of the given function will cut on the x− axis at a point (3.0). Students are advised to draw the graph carefully to avoid any mistake.