Question
Question: How do you graph line through the point \[\left( {5, - 3} \right)\] with undefined slope?...
How do you graph line through the point (5,−3) with undefined slope?
Solution
If the slope of a line is undefined, then the line is a vertical line, so it cannot be written in slope-intercept form, but it can be written in the form: x=a, where a is a constant. Here, the line has an undefined slope and passes through the point (5,−3), then the equation of the line is at x=5.
Complete step by step solution:
The line with undefined slope means that the line is parallel to the y-axis (If we measure its slope, then you would get division by zero which is undefined)
The equation of the line is x=a, where a is the value of the x-coordinates that the line passes through.
In this case it passes through(5,−3)hencex=5 is the equation.
To graph plot (5,−3), (5,1) and so on any point with x=5.
Here is the graph of x=5.
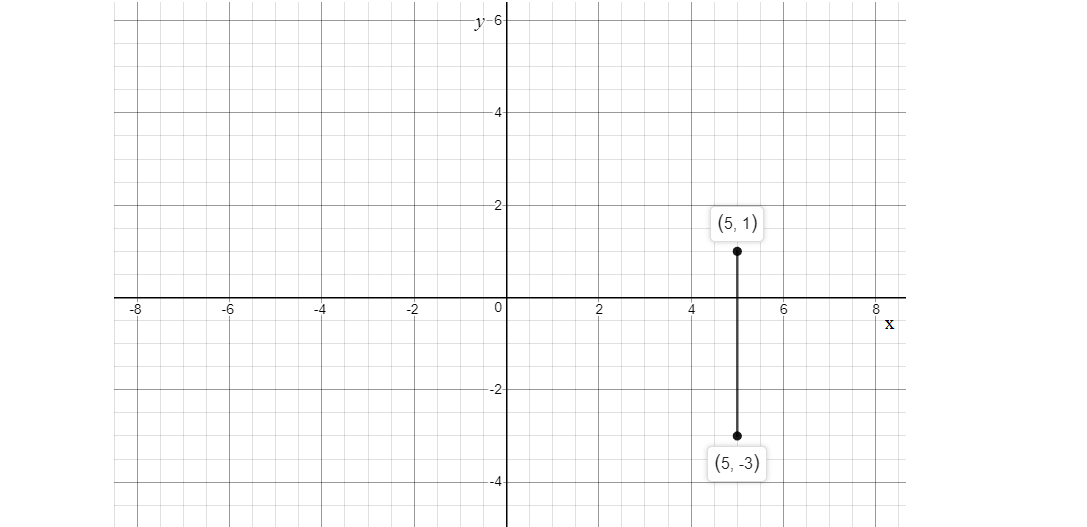
As shown above, the graph line through the point (5,−3), is a vertical line as the slope of the line is undefined.
Note: The key point to note is that, if the slope of the line is undefined, then, by definition the line is a vertical line. Since we did not have a change in the x values, the denominator of our slope is 0. This means that we have an undefined slope. The slope of a line characterizes the direction of a line and to find the slope, you divide the difference of the y-coordinates of two points on a line by the difference of the x-coordinates of those same two points.