Question
Question: How do you graph \(f(x) = {x^3} - 2x - 4\)?...
How do you graph f(x)=x3−2x−4?
Solution
According to the question we have to determine the graph of the given expression f(x)=x3−2x−4 which is as mentioned in the question. So, first of all to determine the required graph of the given polynomial expression we have to determine the y-intercept which can be obtained by substituting the value of the variable x as 0.
Now, we have to determine the x-intercept which can be determined by substituting the value of the variable y as 0.
Now, I have to determine the y-intercept which can be obtained by substituting the value of the variable x as -1, -2, -3.
Now, I have to determine the y-intercept which can be obtained by substituting the value of the variable x as 1, 2, 3.
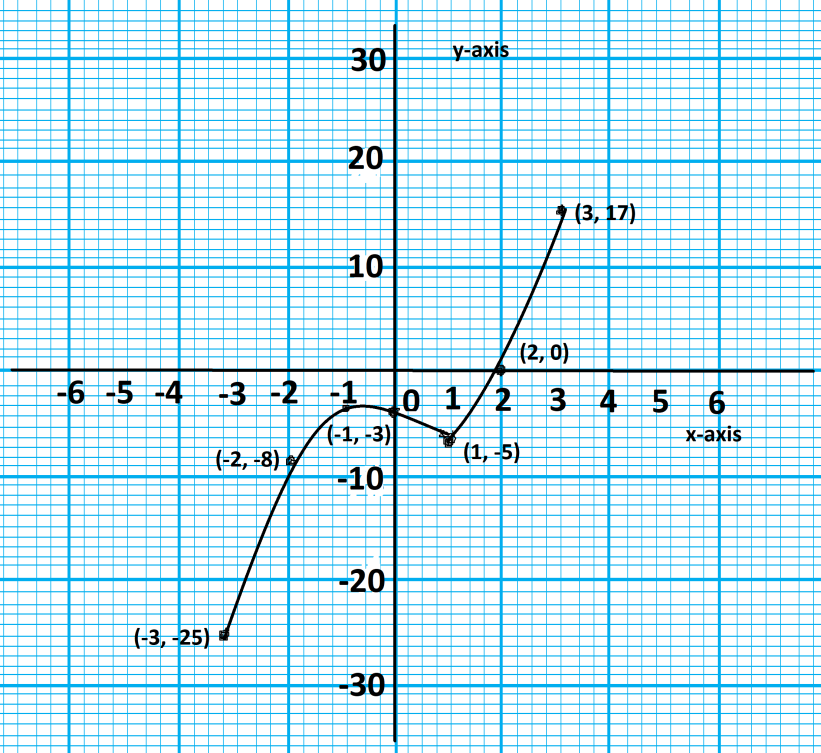
Now, with the help of all points or we can say the y and x-intercepts we can draw the graph for the given expression and with the help of the table obtained.
Complete step-by-step solution:
Step 1: First of all to determine the required graph of the given polynomial expression we have to determine the y-intercept which can be obtained by substituting the value of the variable x as 0. Hence,
⇒y=03−2(0)−4 ⇒y=−4
Step 2: Now, we have to determine the x-intercept which can be determined by substituting the value of the variable y as 0. Hence,
⇒0=x3−2x−4 ⇒x3−2x=4
We can not factor the cubic function above,
Step 3: Now, I have to determine the y-intercept which can be obtained by substituting the value of the variable x as -1, -2, -3. Hence,
On substituting x=−1
⇒y=(−1)3−2(−1)−4 ⇒y=−1+2−4 ⇒y=−3
Hence, the points obtained are (−1,−3)
On substituting x=−2
⇒y=(−2)3−2(−2)−4 ⇒y=−8+4−4 ⇒y=−8
Hence, the points obtained are (−2,−8)
On substituting x=−3
⇒y=(−3)3−2(−3)−4 ⇒y=−27+6−4 ⇒y=−25
Hence, the points obtained are (−3,−25)
Step 4: Now, I have to determine the y-intercept which can be obtained by substituting the value of the variable x as 1, 2, 3. Hence,
On substituting x=1
⇒y=(1)3−2(1)−4 ⇒y=1−2−4 ⇒y=−5
Hence, the points obtained are (1,−5)
On substituting x=2
⇒y=(2)3−2(2)−4 ⇒y=8−4−4 ⇒y=0
Hence, the points obtained are (2,0)
On substituting x=3
⇒y=(3)3−2(3)−4 ⇒y=27−6−4 ⇒y=17
Hence, the points obtained are (3,17)
Step 5: Now, with the help of all points or we can say the y and x-intercepts we can draw the graph for the given expression and with the help of the table obtained.
| x | y |
|---|---|
| -3 | -25 |
| -2 | -8 |
| -1 | -3 |
| 0 | -4 |
| 1 | -5 |
| 2 | 0 |
| 3 | 17 |

Hence, we have determined the graph for the given polynomial f(x)=x3−2x−4 which is as mentioned below:
Note: To plot the points such as (a, b) in the graph it is necessary that first of all we have to plot point a in the x-axis of the quadrant then we have to plot point b to the y-axis of the graph.
On substituting the value of the variable y as 0 to obtain the x-intercept we can’t determine the required intercept due to the expression x3−2x=4.