Question
Question: How do you graph \(f(x)=-\dfrac{1}{2}x-3\) using a table of values?...
How do you graph f(x)=−21x−3 using a table of values?
Solution
In the method of table of values, we simply choose some values of x and find the value of the function for these values of x. Then plot these points on the Cartesian plane to draw the graph. Choose any 2 values of x and find the values of f(x) for those.
Complete step by step solution:
The easiest graph to plot is the graph of a line from the given equation of line.
One of the methods to plot the graph of a function is by using a table of values. In this method, we simply choose some values of x and find the value of the function for these values of x. Then plot these points on the Cartesian plane to draw the graph.
Let f(x)=y.
Then the given equation changes to y=−21x−3 …. ()
We can see that the given equation is the slope-intercept form of the equation of a straight line.
I.e. y=mx+c, where m is the slope of the line and c is the y intercept.
Therefore, we have confirmed that the given equation is an equation of a straight line. By geometry we know that we need just 2 points that lie on the line to plot the line.
Therefore, let us choose any 2 real values of x and substitute them in equation (i).
Let us choose the 2 values as x=0 and x=1.
Now, substitute x=0 in equation (i).
⇒y=−21(0)−3
⇒y=−3
Then, substitute x=1 in (i).
⇒y=−21(1)−3
⇒y=−21−3=−27
Now, make a table for x coordinates of the points and their respective y coordinates.
\begin{array}{*{35}{l}}
x & y \\\
0 & -3 \\\
1 & -\dfrac{7}{2} \\\
\end{array}
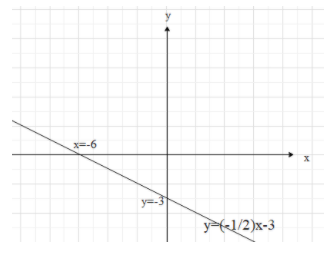
This means that the 2 points on the line are (0,−3) and (1,−27).
Now, plot these two points on a Cartesian plane and draw the line that connects both the points.
Note:
Note that the method of table of values works with an equation of a straight line only. Since a straight line has constant slope we can just find some points and draw the line.
However, other functions with variable slope need much analysis then just some points. We have to check how the function behaves in some intervals. This can be done using continuity and differentiation.