Question
Question: How do you graph \(f(x) = - 5x - 1\) by plotting points?...
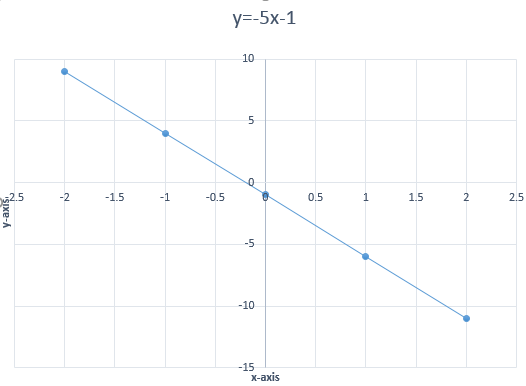
How do you graph f(x)=−5x−1 by plotting points?
Solution
In the given question an equation is given to draw a graph by plotting points. Note that the above equation is in the form of an equation of straight line which is given by y=mx+c, where m is the slope of the line and c is a constant. We substitute different values of x and obtain the values of y. Then we plot the points (x,y) in the x-y plane and we will have a required graph of the given equation.
Complete step by step solution:
Given an equation of the form f(x)=−5x−1.
Note that the given equation needs to be solved which is in the form of a linear equation.
The above equation is in the form of an equation of a straight line.
The general form of an equation of a straight line is given by y=mx+c,
Where m denotes the slope of the line and c is a constant.
So write the above equation as,
y=−5x−1 …… (1)
Comparing with the general equation of a straight line we get,
m=−5 and c=−1.
Now to draw a graph of a linear equation, we first assume some values for the variable x and substitute in the above equation and obtain the values of the other variable y.
Then plotting these values of x and y on the x-y plane, we get the graph of the given equation.
We first let different values of x.
Substituting x=0 in the equation (1), we have,
y=−5(0)−1
⇒y=−1
Therefore, for x=0 we have y=−1.
Substituting x=1 in the equation (1), we have,
y=−5(1)−1
⇒y=−6
Therefore, for x=1 we have y=−6.
Substituting x=2 in the equation (2), we have,
y=−5(2)−1
⇒y=−11
Therefore, for x=2 we have y=−11.
Substituting x=−1 in the equation (1), we have,
y=−5(−1)−1
⇒y=4
Therefore, for x=−1 we have y=4.
Substituting x=−2 in the equation (1), we have,
y=−5(−2)−1
⇒y=9
Therefore, for x=−2 we have y=9.
| x | -2 | -1 | 0 | 1 | 2 |
|---|---|---|---|---|---|
| y | 9 | 4 | -1 | -6 | -11 |
Note :
Graph of a linear equation is always a straight line. Remember the general form of an equation of a straight line given by y=mx+c, where m is the slope of the line and c is a constant.
If while calculating points, if someone has made a mistake then all the points obtained after calculations will not come on a straight line. So, we need to calculate carefully while doing calculations for points and also while plotting in x-y plane.