Question
Question: How do you graph \[f(x) = 2{x^2} - x + 1\] and identify the x intercepts, vertex?...
How do you graph f(x)=2x2−x+1 and identify the x intercepts, vertex?
Solution
We compare the given quadratic equation with general quadratic equation and write values of coefficients. Use the formula to calculate the value of vertex and substitute the values in it. Now use the concept of intercept that those are the points where the graph cuts the axes. Put y coordinate 0 to obtain value of x intercept. Calculate coordinates of points to plot the graph.
- The general quadratic equation is ax2+bx+c=0
- Vertex (h,k) is given by the formula h=−2ab;k=f(h), where f is the function given to us.
- For a general quadratic equation ax2+bx+c=0, roots are given by formula x=2a−b±b2−4ac
Complete step-by-step answer:
We are given the equation f(x)=2x2−x+1
We compare the equation on right hand side to the general quadratic equation ax2+bx+c=0
We get the values a=2,b=−1,c=1
We know that vertex (h,k)is given by the formula h=−2ab;k=f(h), where f is the function given to us
Here function is f(x)=2x2−x+1 ……..(1)
We substitute the values of ‘a’ and ‘b’ in formula of ‘h’
⇒h=−2×2−1
Cancel same factors from numerator and denominator,
⇒h=41
Now we calculate the value of ‘k’ by substituting value of ‘h’ in place of ‘x’ in the function
⇒k=f(41)
⇒k=2(41)2−41+1
Calculate the products on right hand side of the equation
⇒k=162−41+1
Cancel same factors from numerator and denominator
⇒k=81−41+1
Take LCM on RHS
⇒k=81−2+8
⇒k=87
⇒ Vertex (h,k)=(41,87)
∴The vertex of f(x)=2x2−x+1 is (h,k)=(41,87)
We know that x-intercept means the point on x-axis where the line cuts the axis and y-intercept means the point on y-axis where the line cuts the y-axis.
Now we calculate the x-intercept of the graph by substituting the value of y as 0, i.e. put f(x)=0 in the equation
⇒2x2−x+1=0
We can use determinant method to solve for the value of x,
I.e. x=2a−b±b2−4ac
Substitute the value of a=2,b=−1,c=1
⇒x=2×2−(−1)±(−1)2−4×2×1
⇒x=41±1−8
⇒x=41±−7
We know that [\sqrt { - 1} = i]
⇒x=41±i7
So, the value of x is not a real number, it is a complex number.
⇒Graph of the given function does not have x-intercept.
Now we plot of the graph of the function[f(x) = 2{x^2} - x + 1]by substituting points
We put x=0 in the equation, the f(x)=2×0−0+1 i.e. f(x)=1
So, the point becomes (0,1)
Now we put x=1 in the equation, then f(x)=2×1−1+1 i.e.[f(x) = 2]
So, the point becomes, (1,2)
We will mark the points (0,1), (1,2) and [(\dfrac{1}{4},\dfrac{7}{8})] on the graph. 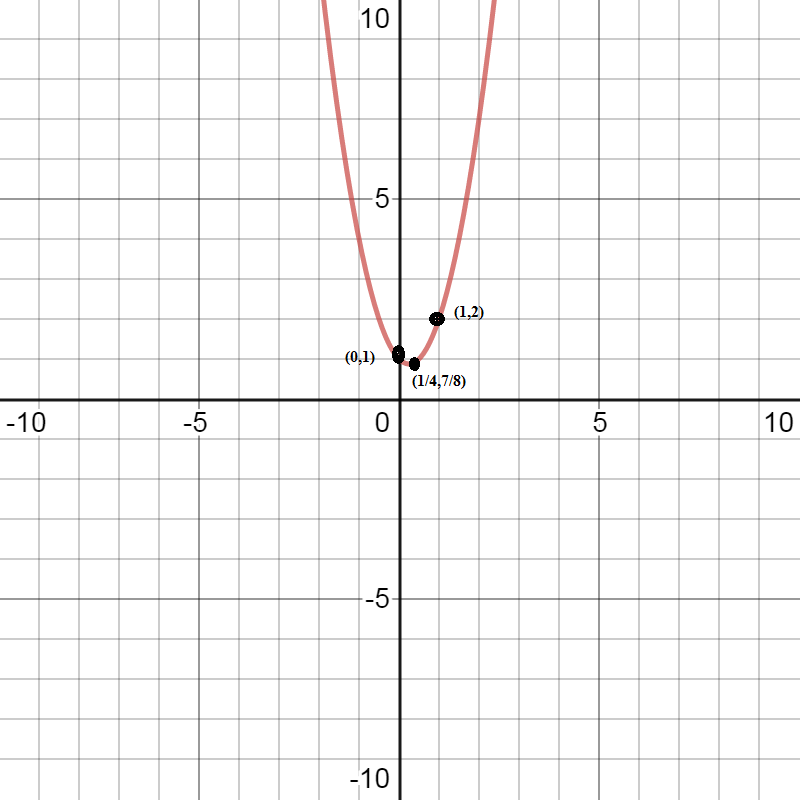
Note:
Many students make the mistake of writing the coordinates wrong as here the function f(x) is given in place of y, keep in mind the function is dependent on x and we will write the value of y as value of the function obtained by putting in the value of x.