Question
Question: How do you graph \(f(x) = 1 + \cos x\)?...
How do you graph f(x)=1+cosx?
Solution
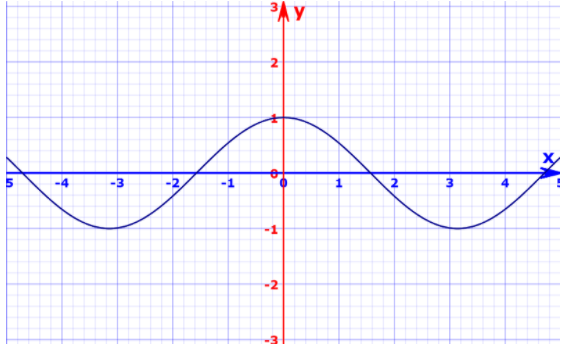
Cosine is a trigonometric function whose range is from negative 1 to positive 1. It is a periodic function that is why it gives the same value if its period is added or subtracted from a particular input. If any constant is added to it, it will only change the range of cosine function.
Complete step by step solution:
We can clearly observe from the graph that the range of cosx is from negative of one to positive of one.
When we add any constant to it, all the output of the function will get increased by that constant. So in this case, as given in the question the constant is 1, so we will 1 with cosx.
So, now the resultant graph will be as a given below,
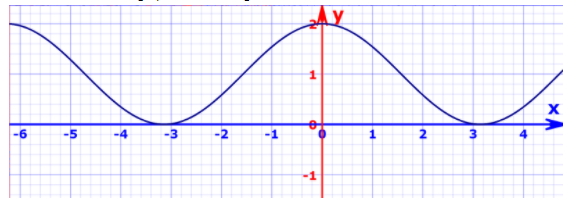
We can clearly observe that the maxima are now 2 whereas it was 1 and the minima are now 0 whereas it was -1. Other than this, nothing else will change like the period of the function will remain the same and its other characteristics will also remain the same.
Note: As cosine is a periodic function it will repeat itself after an interval. We can add or subtract any constant from it and again plot the new graph. If we have subtracted any constant value from the trigonometric function, we might have received a graph with its maxima lower than its original maxima and also minima lower than its original minima. But after that also, other characteristics will remain the same as the previous function.