Question
Question: How do you graph \(f\left( x \right)=\tan x\) and include two full periods?...
How do you graph f(x)=tanx and include two full periods?
Solution
To graph f(x)=tanx including two full periods, we need to first of all know the period of tanx and then multiply the period of tanx by 2. We know the period of tanx is π. Now, we need some points to plot this graph in two full periods. For that, we are going to use the tangent at some angles like 0,6π,3π,4π,2π and then plot these points on the graph.
Complete step by step solution:
In the above problem, we are asked to graph f(x)=tanx in two full periods.
First of all, we will plot this function f(x) in one full period then repeat the same profile in the next period also.
We know that the period of tanx is π so we are plotting the graph from 0 to π. To graph the function, we need some points so we are going to plot the following angles of tan on the graph paper:
tan0=0;tan6π=31;tan4π=21;tan3π=3;tan2π=∞
In the above equations, let us name the first point when angle is 0 as A, then when angle is 6π, name this angle as point B and so on till angle 2π so naming these angles will look like:
tan0=0;(A)tan6π=31;(B)tan4π=1;(C)tan3π=3;(D)tan2π=∞(E)
Plotting the above points on the graph paper and joining them we get,
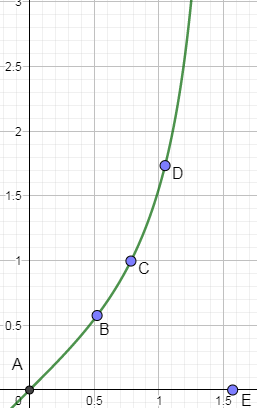
You might be wondering why we have plotted E on the x axis because the y at x=2π is not defined.
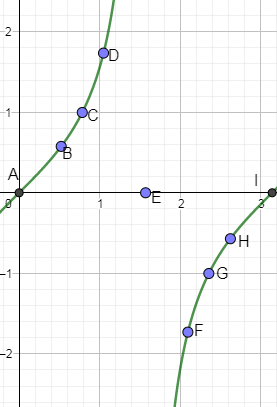
Now, we are plotting the points for the angles from 2πtoπ.
tan2π=∞;(E)tan65π=−31;(F)tan43π=−1;(G)tan32π=−3;(H)tanπ=0(I)
Plotting the above points on the graph paper we get,
Now, repeat this graph from πto2π and we get,
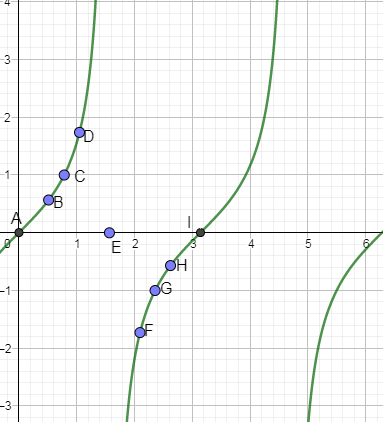
Hence, we have drawn the graph of f(x)=tanx including two full periods.
Note: To solve this problem you should know the values of tan at different angles then you can plot them and get the profile of the curve. Also, you should know the period of tan then you can draw for the two full periods.