Question
Question: How do you graph \(f\left( x \right) = \ln x - 1\)?...
How do you graph f(x)=lnx−1?
Solution
First draw a rough graph of lnx to understand the nature and shape of lnx−1. We know that the graph of lnx will be increasing throughout the positive x−axis from −∞ at x=0 to ∞ as x→∞. Then shift the graph of lnx downwards by 1 unit to get the correct graph of lnx−1.
Complete step-by-step solution:
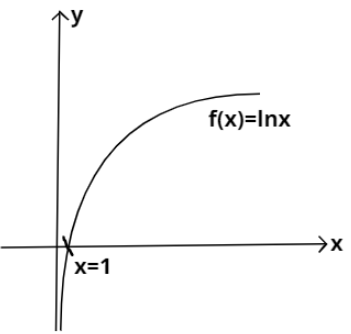
According to the question, we have to show how to draw the graph of f(x)=lnx−1. For this, first we’ll draw the graph of lnx for reference to get the clear understanding of the nature and shape of lnx−1.
We know that the graph of lnx will be increasing throughout positive x−axis from −∞ as x→0 to ∞ as x→∞ while having 1 as its value at x=0. And lnx is defined for only positive x so the graph will not have anything on the negative side of the x−axis. Based on these observations, the graph of lnx is as shown below:
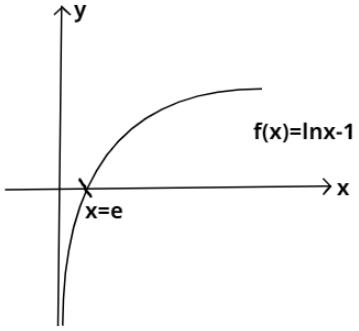
Now, for the graph of lnx−1, we will just shift the above graph of lnx downwards by 1 unit . For finding out the point where it cuts x−axis, we’ll put lnx−1 to zero. So we have:
⇒lnx−1=0 ⇒lnx=1 ⇒x=e
So lnx−1 will cut the x−axis at x=e.
The graph of f(x)=lnx−1 is shown below:
Note: If we know the graph of y=f(x), then we can draw graphs related to this using the following rules:
(1) For the graph of y=f(x)±a, shift the graph of y=f(x) by a units upward or downward for positive and negative signs respectively.
(2) For the graph of y=f(x±a), shift the graph of y=f(x) by a units left or right for positive and negative signs respectively.