Question
Question: How do you graph, \(f\left( x \right)=\dfrac{{{x}^{2}}}{x-4}\) using holes, vertical and horizontal ...
How do you graph, f(x)=x−4x2 using holes, vertical and horizontal asymptotes, X and Y intercepts?
Solution
Holes are the points in the plot of a graph where the graph is undefined. Vertical and horizontal asymptotes are the lines which the graph tends to touch at infinity. And X and Y intercepts are the intercept made by the graph on the X and Y axis respectively. We shall find all of them and then plot our graph to get the solution to our problem.
Complete step-by-step solution:
The first parameter that we need to find out is the point of no definition in our graph or holes. For this the numerator and denominator should have a common factor that can be equal to zero or infinity simultaneously. Our expression is:
⇒f(x)=x−4x2
Which clearly has no common factors in numerator and denominator. So, there are no holes in the plot of our graph.
Now, the second parameter that we need is vertical and horizontal asymptotes. The vertical asymptote can be found by equating the denominator of our expression to zero. This is done as follows:
⇒x−4=0⇒x=4
Therefore, the line: x=4, is our vertical asymptote.
Now, the horizontal asymptote of our graph is obtained by comparing the degrees of numerator and denominator and it defines the end behavior of our graph plot. The graph can also intersect it.
Since the degree of the numerator is greater than the denominator, the graph has no ‘proper’ horizontal asymptotes but a slanted one. Therefore, we won’t consider a slant asymptote as a horizontal asymptote.
Now, the third and final parameter is the intercepts. The value of function at, x=0 is the Y intercept and the value of ‘x’ for which our function is zero, is the X intercept.
Therefore, at x=0, we get:
⇒f(x)=x−402∴f(x)=0
And at f(x)=0, we get:
⇒0=x−4x2⇒0=x2∴x=0
Therefore, we get both the X and Y intercepts of our graph as zero.
Now, that we have all the required parameters to our graph, the graph can be plotted as follows:
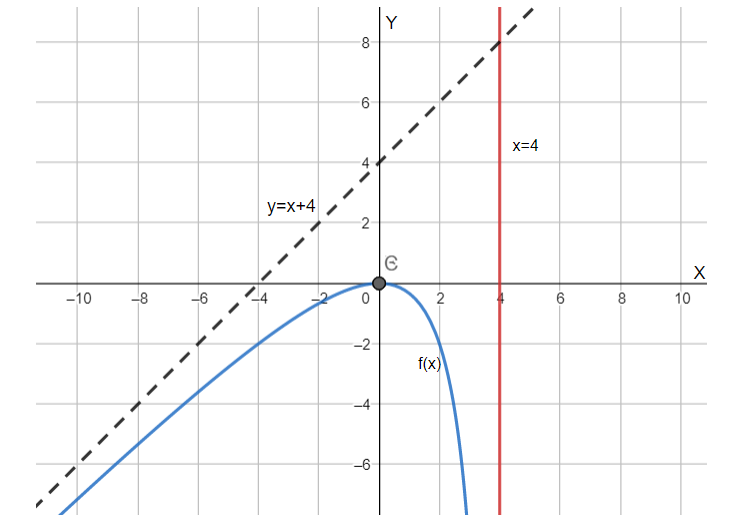
Hence, the graph has been plotted with the help of its holes, vertical and horizontal asymptotes and its X and Y intercepts.
Note: The black dotted line in the above graph as our slant asymptote which, if the degree of our expression would have been the same , would be horizontal. This slant asymptote can be calculated by using the method of synthetic division of our asymptotes, which is out of our scope at this stage.