Question
Question: How do you graph \(f\left( x \right) = \dfrac{7}{{x + 4}}\) using holes, vertical and horizontal asy...
How do you graph f(x)=x+47 using holes, vertical and horizontal asymptotes, x and y intercepts?
Solution
In this problem, we have to solve the equation to graph the given equation. by using the holes, vertical asymptotes, horizontal asymptotes, and intercepts we can solve this problem. First of all, we must have a clear idea about the terms holes, vertical and horizontal asymptotes, and intercepts. Now, we can solve the given graph easily.
Complete step by step answer:
In the problem the given equation is, f(x)=x+47
First, we are going to use the holes in the given equation.
The term hole means that a hole in the graph.
When the numerator and denominator of the given equation are the same factors, then the equation is called the hole.
But the given equation for our problem f(x)=x+47 does not have the same factors.
We see that there are no factors in the numerator and denominator of the function.
Therefore, there are no holes in the given equation.
Next, we are going to find the vertical asymptotes.
Vertical asymptotes are defined as the vertical lines which get closer and never touches.
To find the given equation has asymptotes we set the denominator of the function is equal to zero
Now from our equation take the denominator, x+4
And equals our denominator to zero. And solve this, we get
x+4=0
Now solve this,
x=−4
Therefore the vertical asymptotes are x=−4
Next, we are going to find the horizontal asymptotes.
For finding the horizontal asymptotes there are some rules.
Let us assume that, a=degree of the numerator
b=degree of the denominator.
The first rule is when the a is greater than, there is no horizontal asymptote.
And the second rule is when both degrees are equal divide the coefficient of numerator and denominator.
The third rule is when the a is less than bthan the horizontal asymptote is y=0
Now we see our equation
f(x)=x+47
In this equation, the denominator has a higher degree.
Therefore the horizontal asymptotes are y=0
Now find the x− intercept.
It means that where the graph touches the x−axis.
Now, the set the numerator is equal to zero.
In the given equation,
7=0
But this is never true.
Therefore in this equation, there is no x− intercept.
Finally, we are going to find the y− intercepts.
y− intercepts are the values when giving the value zero for x where the graph touches the y− axis.
Therefore, f(0)=0+47
Now solve this, we get f(0)=47
Therefore the y− intercept is (0,47)
Hence we solve this problem.
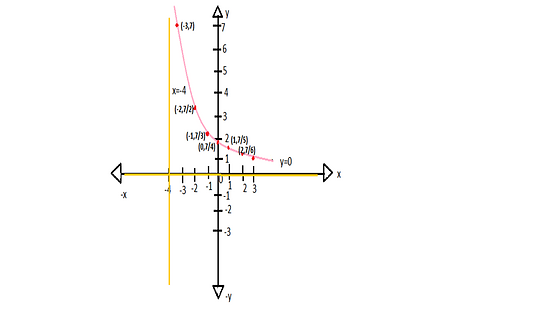
Here yellow color line represents the vertical and horizontal asymptotes and the pink curve represents the y-intercept.
the y-intercept is drawn by putting the values −4,−3,−2,−1,0,1,2,3,4,...... in the place x in the given function f(x)=x+47
Note:
To solve this problem just know what are the explanations for the given terms. Asymptote is defined as a straight line that continuously approaches a given curve. But it does not meet at any distance. In simply we say that the values you get closer and closer but never they meet.