Question
Question: How do you graph Boyle’s law?...
How do you graph Boyle’s law?
Solution
Boyle's law is a gaseous law in which we make a relation between the pressure of the gas and the volume of the gas at a constant temperature. The formula given by Boyle is PV=k, in which k is constant. So, we can plot three graph: (i) P vs 1/V, (ii) PV vs P, (iii)- P vs V
Complete step-by-step answer: There are many laws that are used to plot relations between different properties of the gas, such laws are Boyle's law, Charles' law, Gay-Lussac's law, etc.
Boyle’s law was given by Robert Boyle in 1662. Boyle's law is a gaseous law in which we make a relation between the pressure of the gas and the volume of the gas at a constant temperature. On experimenting, he found that when the temperature is constant then the volume of the gas is inversely proportional to the pressure of the gas. Mathematically, it is given as:
V∝P1
When the proportionality constant is removed, we get:
PV=k
In this, k is constant.
So, we can plot three graph: (i) P vs 1/V, (ii) PV vs P, (iii)- P vs V
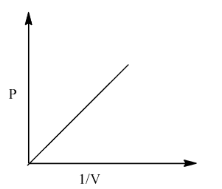
(i)- P vs 1/V
When this graph is plotted then we get a straight line passing from the origin. The graph is given below:
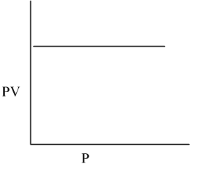
(ii) PV vs P
When this graph is plotted then we get a straight line that is parallel to the x-axis on which the pressure is taken. The graph is drawn below:
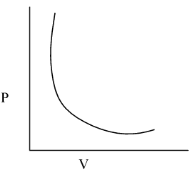
(iii)- P vs V
When this graph is plotted we get a hyperbola in the first quadrant. The graph is drawn below:
Note: The significance of Boyle's law is that it proves that the gas is compressible, as the pressure increases the volume decrease that makes the gas denser and heavier.