Question
Question: How do you graph Boyle’s law?...
How do you graph Boyle’s law?
Solution
Hint Boyle’s law studies the relationship between the pressure and volume of a gas at constant temperature. That is why the graph for Boyle’s is called an isotherm. The volume of the gas is going to represent with V and pressure is going to represent with P.
Complete answer:
- In the question it is asked to draw the graph for Boyle’s law.
- Boyle’s law states that the pressure is a certain amount if gas is inversely proportional to volume of the gas at constant temperature.
- We know that as the pressure of the gas increases then the volume of the gas decreases.
- Means
P∝V1
Here P = pressure of the gas and V = volume of the gas at constant temperature.
- If we are going to draw a graph by taking pressure of the gas ‘P’ on x- axis and volume of the gas ‘V’ on y- axis for a given mass of the gas at constant temperature we will get the following graph
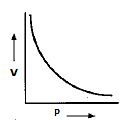
- The graph depicts that as the pressure on the gas increases then the volume of the gas decreases automatically.
- The above graph is also called isotherm due to constant temperature.
Note: If we are going to draw a graph by taking V against 1/P for a given amount of gas then we will get a straight line because pressure of the gas and volume of the gas are inversely proportional to each other.