Question
Question: How do you graph basic polar equations?...
How do you graph basic polar equations?
Solution
In this problem we need to give the detailed procedure to graph the basic polar equations. To graph any equation, we need to have points which satisfies the given equation. We will list all the points which lie on the given equation for various dependent variables. Now we will construct a table with all the points we have and mark them in the polar coordinate system. Now we will join all those points in the polar coordinate system to get the graph of the polar equation.
Complete step-by-step answer:
For a given polar equation, we will consider the following equation
r=f(θ)
In the above equation the variable θ is the independent variable and the variable r is the dependent variable.
To graph the polar function we need to find the points which lie at a distance of r from the origin and make an angle θ with the x axis.
So to find the points which lies on the given equation, we will consider the values of the independent variable which is θ like θ=4π,2π,π,23π,.... We will substitute these values in the given equation and calculate the values of r.
For an example consider the polar equation r=3.
For various values of θ, the values of r as follows
| θ | r |
|---|---|
| 0 | 3 |
| 4π | 3 |
| 2π | 3 |
| 43π | 3 |
| π | 3 |
| 45π | 3 |
| 23π | 3 |
| 47π | 3 |
| 2π | 3 |
Now the graph of the equation r=3 is given by
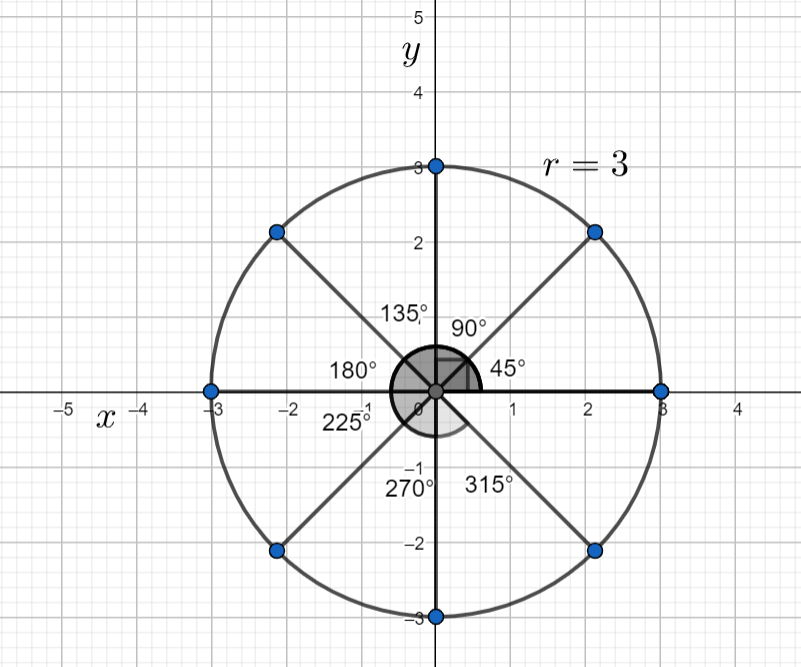
In this way we can draw the graph of the basic polar equations.
Note: We can also try this method to all types of polar equations. If you try to graph the equation r=2cosθ we will get a circle having radius as 1 and having center at (1,0). We can also use this type of the method to the equations having negative values, the difference is only the direction or orientation only.