Question
Question: How do you graph and solve \(|x-5|>7\)?...
How do you graph and solve ∣x−5∣>7?
Solution
To graph an equation that involves an absolute value operator, we must first get rid of the absolute value equation by dividing the equation into different parts. Then graph the equations of these parts separately.
Complete step by step solution:
As the same suggests, inequality refers to something (say some variable) being not exactly equal to something. In other words, we can say that the value of the quantity is not exactly known but we do know some restriction or condition for the value of the quantity.
The given inequality says that ∣x−5∣>7.
Let us first solve this inequality.
We know that when x−5≥0, ∣x−5∣=x−5
This means that when x≥5, ∣x−5∣=x−5
Now, we have to solve for the inequality x−5>7 for x≥5
⇒x>12
This means that for ∣x−5∣>7 to be valid, x>12 ….. (i)
Next, we know that when x−5<0, ∣x−5∣=−(x−5)=−x+5
This means that when x<5, ∣x−5∣=−x+5
Now, we have to solve for the inequality −x+5>7 for x<5
⇒−x>2
⇒x<−2
This means that for ∣x−5∣>7 to be valid, x<−2 …. (ii)
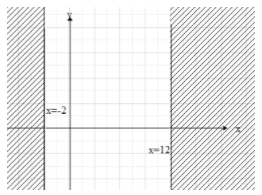
If we combine (i) and (ii), we get that the solution of the inequality is x < -2 and x > 12.
To draw the graph of this inequality, first draw the lines x=−2 and x=12
Then mark the region towards left of the line x=−2 and towards right of the line x=12.
Note:
There is a shortcut to the graph of y=∣x−5∣ and it is as follows.
First draw the graph of the line y=x−5.
Then, flip the line about the x-axis, where x < 5.
We do this because the absolute value operator makes a negative value positive and this case the value of y is negative when x < 5.