Question
Question: How do you graph and solve \[\left| {x - 4} \right| < 9\]?...
How do you graph and solve ∣x−4∣<9?
Solution
Here we use the concept of absolute value with inequality and open the inequality for the given equation. Find the value of x between two numbers by adding or subtracting values to the inequality. Construct the graph of the inequality on x-axis as there is only one variable i.e. x
- Absolute value of an inequality ∣x∣<k can be written as −k<x<k
Complete step-by-step answer:
We are given the inequality ∣x−4∣<9 … (1)
We know the inequality of less than type with modulus i.e. ∣x∣<kcan be written as −k<x<k
So we can write the inequality in equation (1) as −9<x−4<9
Since we have to calculate the value of x, to keep x only in between the signs we will add the value 4 to all three values in the inequality
⇒−9+4<x−4+4<9+4
Add the constant terms in each side of the inequality
⇒−5<x<13
So, the value of x is between -5 and 13
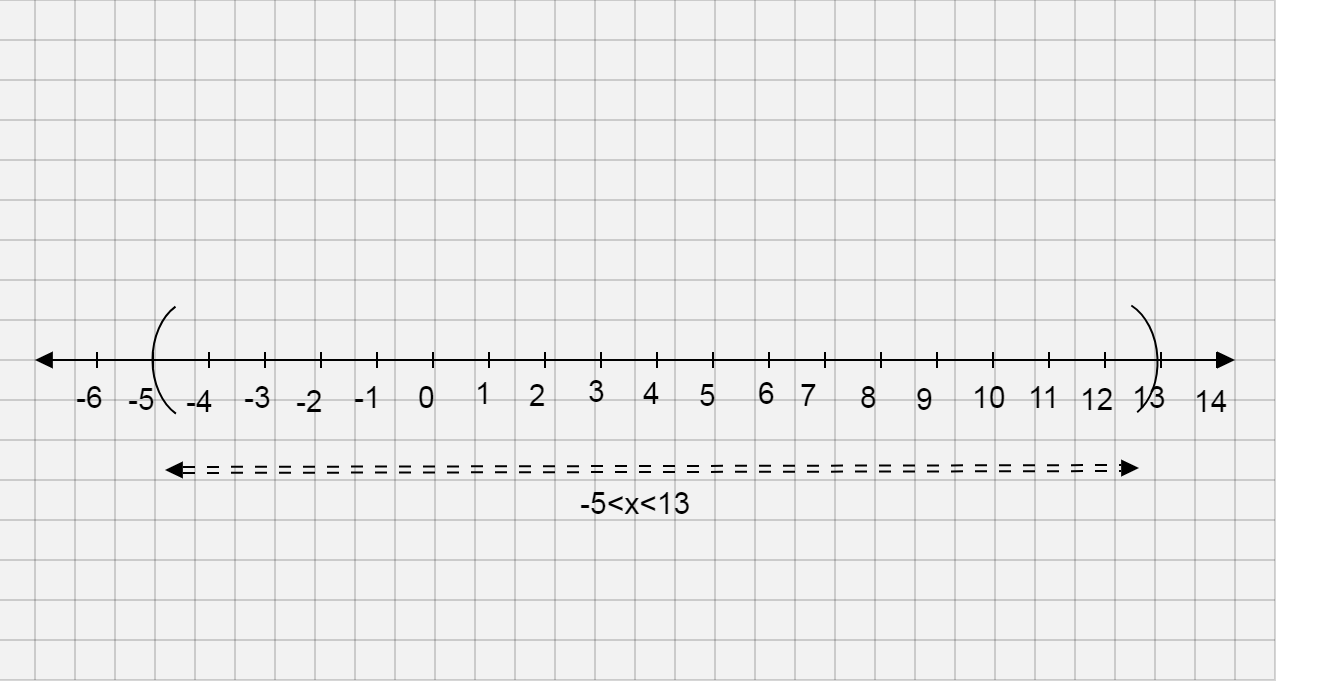
Now we will plot the graph of the inequality −5<x<13
Since we have only one variable, i.e. x we will draw the number line with integers on it

**∴The solution of the inequality ∣x−4∣<9 is −5<x<13 and the graph of the inequality ∣x−4∣<9 is **
Note:
Many students make the mistake of equating the inequality to 0 and then calculate the values of x as 5 and 13 and write their final answer as values of x as 5 and 13 which is wrong. Keep in mind we are given an inequality, so if we equate it to zero that will only give its end points. We have to be careful about taking the points in between or outside the end points as well.